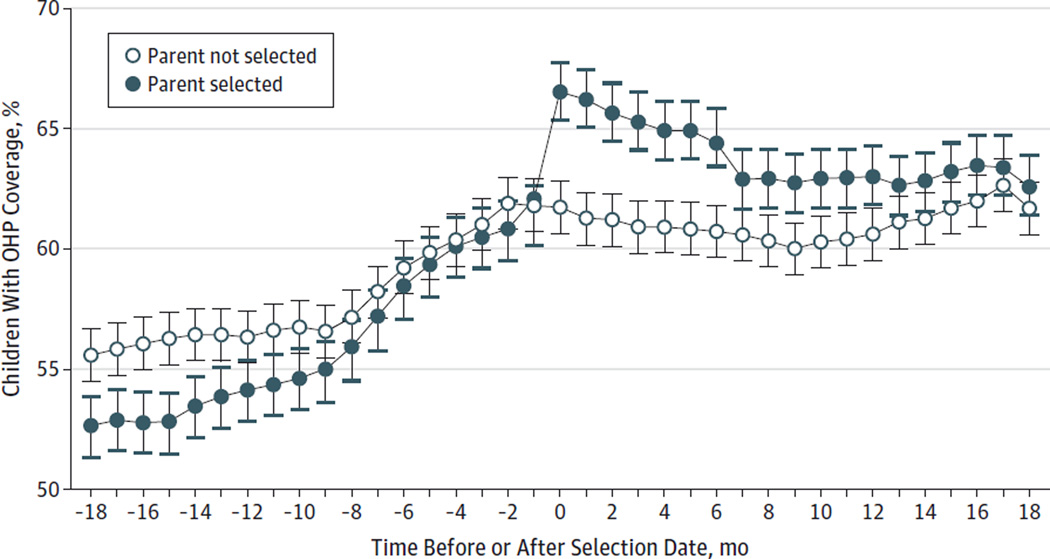
Figure 2.
Percentage of Children With Oregon Health Plan (OHP) Coverage 18 Months Before and After Random Selection of Parents to Apply for OHP Coverage
For the parent selected group, the selection date was the date on which a parent was randomly selected to apply for OHP coverage (the date a child was exposed to the intervention). Based on this distribution of selection dates for the intervention group, a selection date was randomly assigned to children whose parents were not selected (nonexposed controls). Predicted percentages are based on a logit generalized estimating equation model adjusted for covariates found to be significantly different between selected and unselected groups, including parent’s race/ethnicity, number of children in the household, number of parents in the household on the reservation list, Rural-Urban Continuum Code for the child’s zip code, and whether either parent registrant from the reservation list was probabilistically matched to OCHIN electronic health record data. Error bars indicate 95% CIs for the percentage of children with OHP coverage at each time point.

