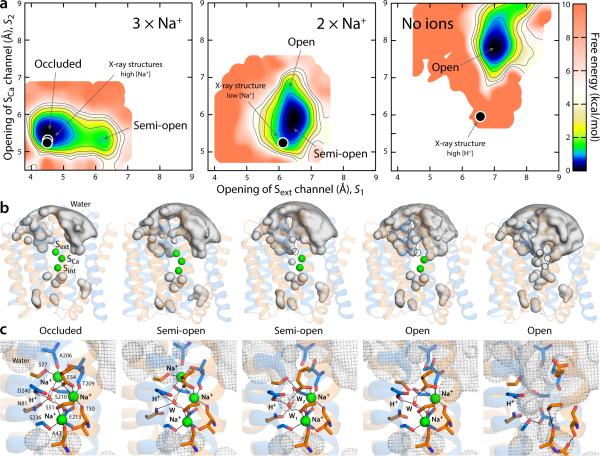
Figure 5.
Thermodynamic basis for the proposed mechanism of substrate control of the alternating-access transition of NCX. (a) Calculated conformational free-energy landscapes for outward-facing NCX_Mj, for two different Na+-occupancy states, and for a state with no ions bound. The free energy is plotted as a function of two coordinates, each describing the degree of opening of the aqueous channels leading to the Sext and SCa sites, respectively (see Methods). Contours correspond to 1 kcal/mol intervals. Black circles map the X-ray structures of NCX_Mj obtained at high and low Na+ concentration, as well as that at low pH, reported in this study. (b) Density isosurfaces for water molecules within 12 Å of the ion-binding region (grey volumes), for each of the major conformational free-energy minima in each ion-occupancy state. Na+ ions are shown as green spheres. The two inverted-topology repeats in the transporter structure (transparent cartoons) are colored differently (TM1-5, orange; TM6-10, marine). (c) Close-up views of the ion-binding region in the same conformational free-energy minima. Key residues involved in Na+ and water coordination (W) are highlighted (sticks, black lines). The water-density maps in (b) is shown here as a grey mesh. Note D240 is protonated, while E54 and E213 are ionized22.

