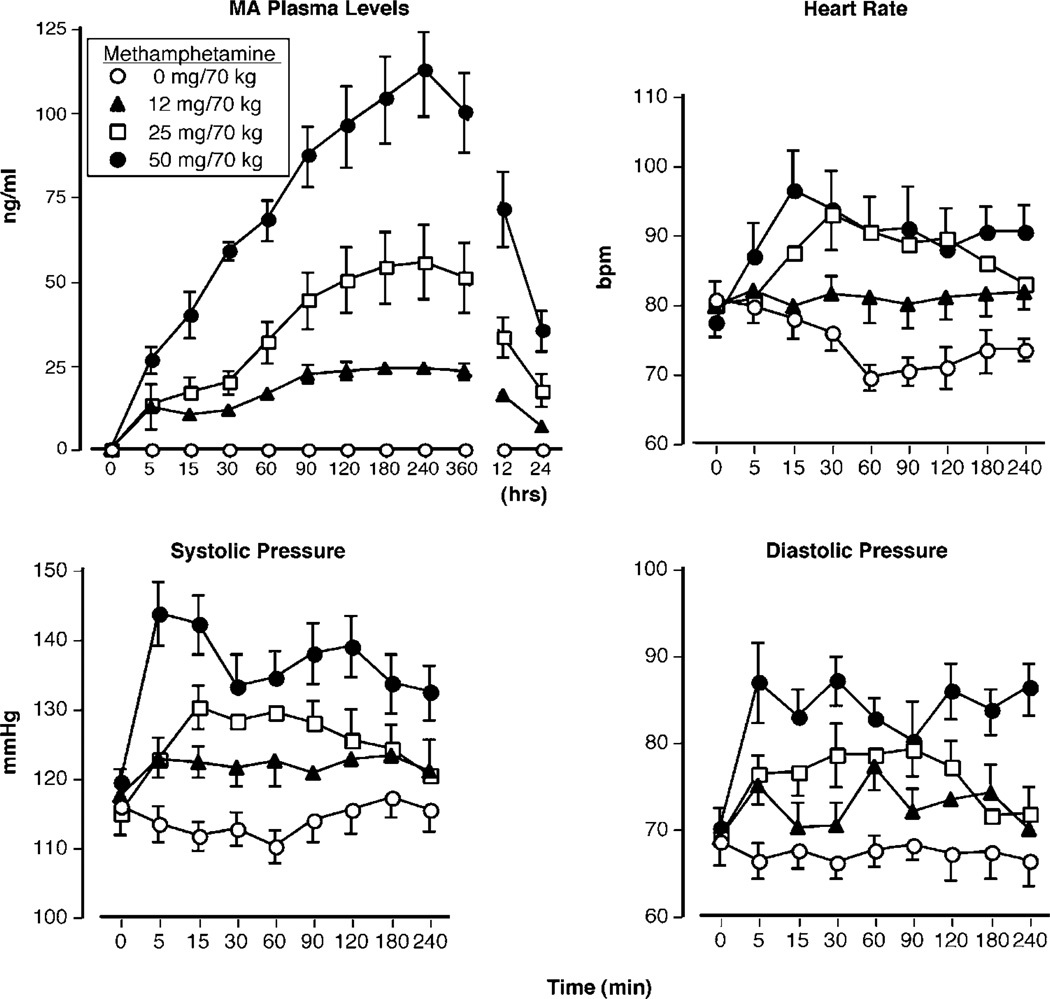
Figure 1.
Upper panel (left): methamphetamine plasma levels as a function of methamphetamine dose and time. Upper panel (right): heart rate as a function of methamphetamine dose and time. Lower panels: systolic and diastolic pressure as a function of methamphetamine dose and time. Error bars represent one SEM. Overlapping error bars were omitted for clarity.

