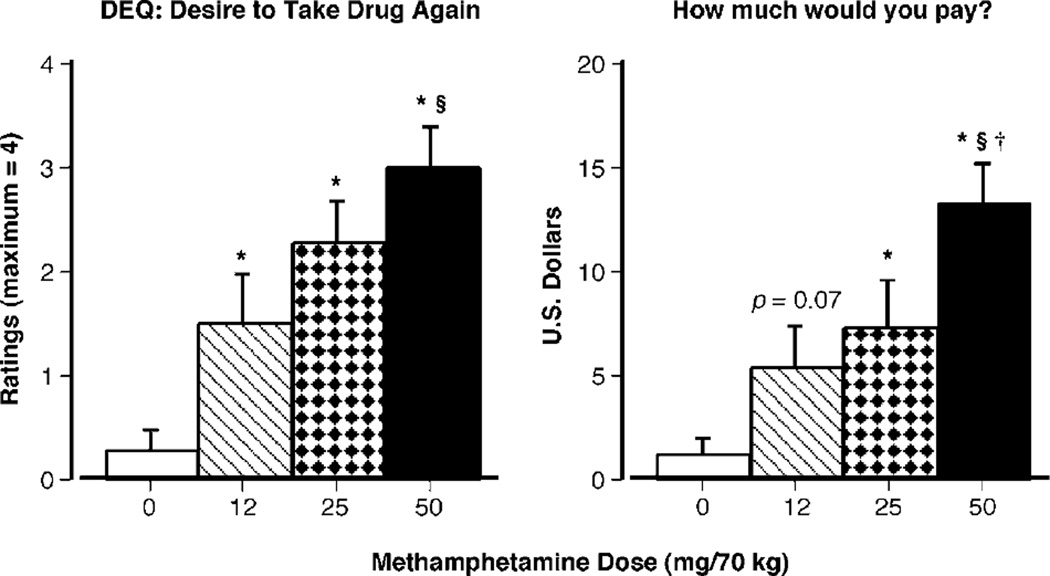
Figure 3.
Selected subjective-effect ratings as a function of methamphetamine dose and time. Error bars represent one SEM. Overlapping error bars were omitted for clarity. An * indicates significantly different from placebo (P < 0.05). An § indicates significantly different from 12 mg/70 kg (P < 0.05). An † indicates significantly different from 25 mg/70 kg (P < 0.05).

