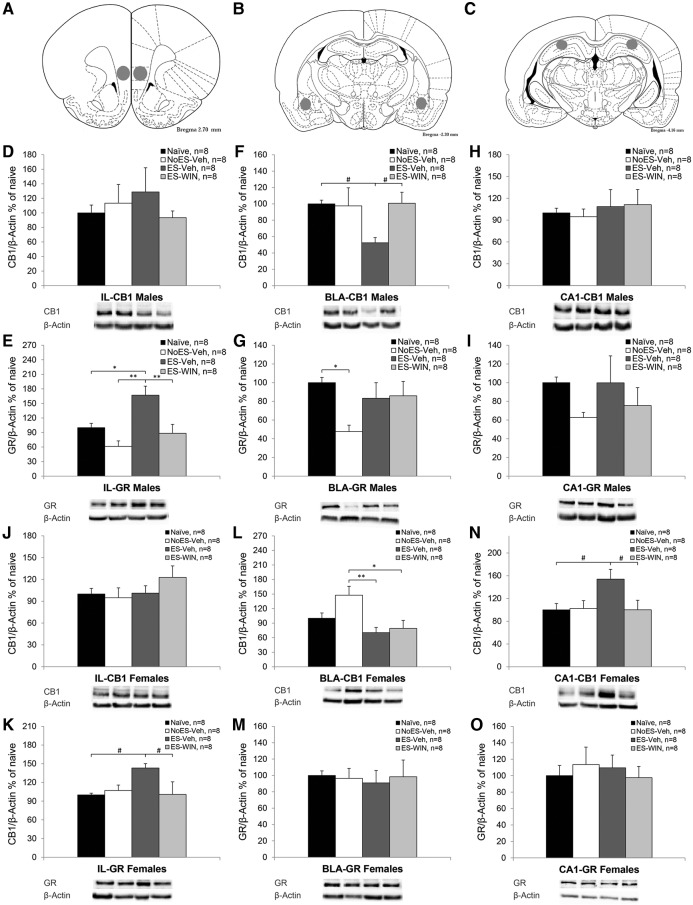
Figure 6.
The effects of exposure to early stress and WIN55,212-2 on CB1 receptors and GRs in the stress circuit. (A) Brain sites from where the tissue samples were extracted. The IL-PFC was obtained by punches (1 mm-diameter) bilaterally. The numbers refer to the distance from Bregma (based on Paxinos and Watson 2006). (B) The BLA was obtained by punches (1-mm diameter) bilaterally. (C) The CA1 was obtained by punches (1-mm diameter) bilaterally. (*P < 0.05; **P < 0.01). (D) In the IL-PFC of males, no significant differences in CB1r were observed between the groups. (E) In the IL-PFC of males, the ES + veh group expressed significantly more GR than all groups. (F) In the BLA of males, the ES + veh group expressed significantly less CB1r than all groups. (G) In the BLA of males, the NoES + veh group expressed significantly less GR than the naïve group. (H) In the CA1 of males, no significant differences in CB1r were observed between the groups. (I) In the CA1 of males, no significant differences were observed in GR between the groups. (J) In the IL-PFC of females, no significant differences in CB1r were observed between the groups. (K) In the IL-PFC of females, the ES + veh group expressed significantly more GR than all groups. (L) In the BLA of females, the NoES + veh group expressed significantly more CB1r than the ES groups. (M) In the BLA of females, no significant differences in GR were observed between the groups. (N) In the CA1 of females, the ES + veh group expressed significantly more CB1r than all groups. (O) In the CA1 of females, no significant differences were observed in GR between the groups. (Lower panel) Representative bands for the expression of GR/CB1r and β-actin.

