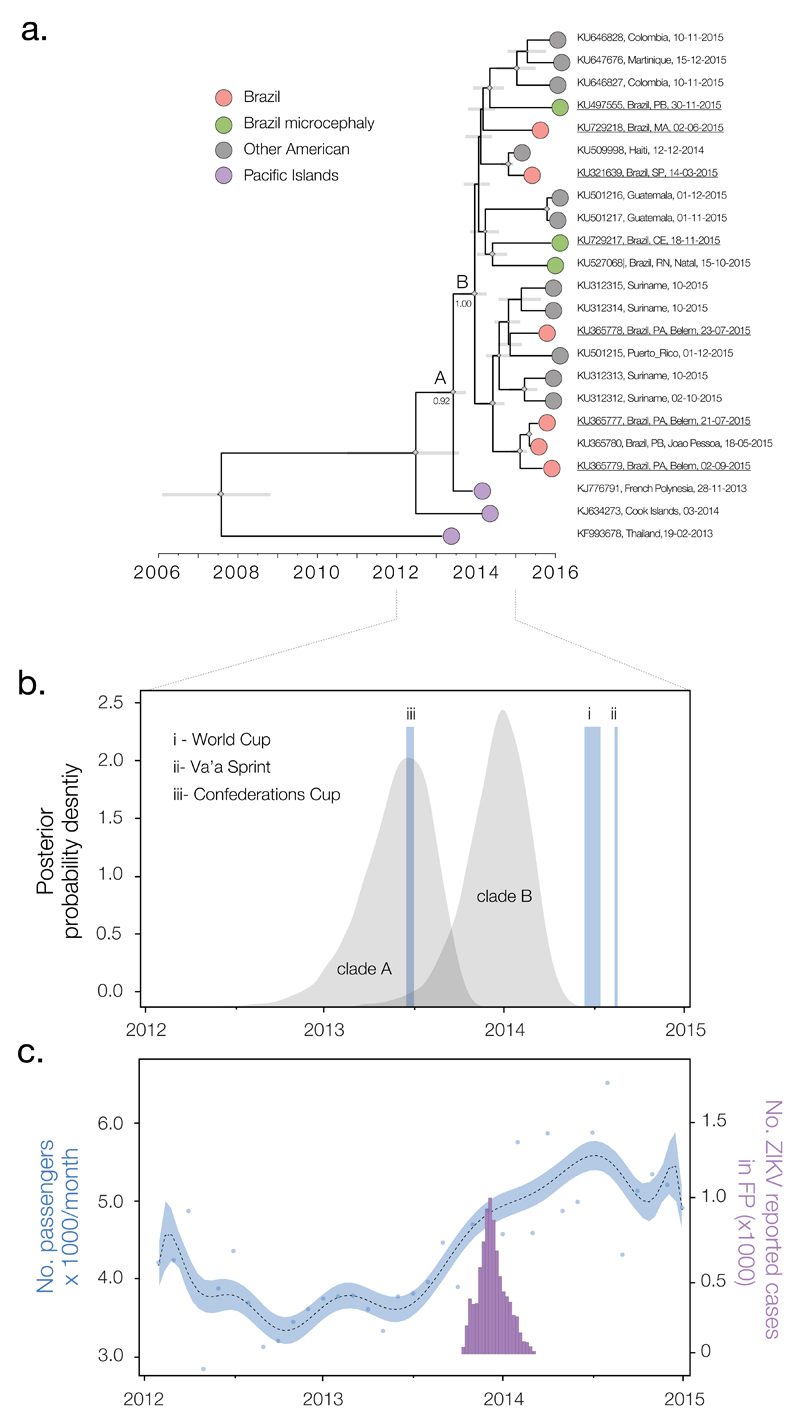
Fig. 3. Timescale of the introduction of ZIKV to the Americas.
(A) Molecular clock phylogeny of the ZIKV outbreak lineage estimated from complete coding region sequences, plus 6 sequences (KJ634273, KU312315, KU312314, KU212313, KU646828, and KU646827) longer than 1500nt (available data as of 7th March 2016). For visual clarity, three basal sequences, HQ23499 (Malaysia, 1966), EU545988 (Micronesia, 2007) and JN860885 (Cambodia, 2010) are not displayed here (see Fig. S3). Gray horizontal bars represent 95% Bayesian credible intervals for divergence dates. A and B denote clades discussed in main text and numbers next to them denote posterior probabilities. Diamond sizes represent, at each node, the posterior probability support of that node. Taxa are labeled with accession number, sampling location, and sampling date. Names of sequences generated in this study are underlined. (B) Posterior distributions of the estimated ages (TMRCAs) of clades A and B, estimated in BEAST software using the best-fitting evolutionary model (table S2). The time and duration of the three events (i-iii) discussed in the main text are shown. (C) Number of airline passengers from specific countries arriving in Brazil per month versus number of suspected cases of ZIKV in French Polynesia. The blue curve (left y axis) shows a polynomial fitting of the number of travelers (blue points) from countries with recorded ZIKV outbreaks between 2012 and 2015 (French Polynesia, Thailand, Indonesia, Malaysia, Cambodia, and New Caledonia) (supplementary materials section 6), aggregated across 20 Brazilian national airports. The purple bars represent weekly numbers of suspected ZIKV cases (right y axis) in French Polynesia (FP) from 30 October 2013 to 14 February 2014 (4).

