FIG. 1.
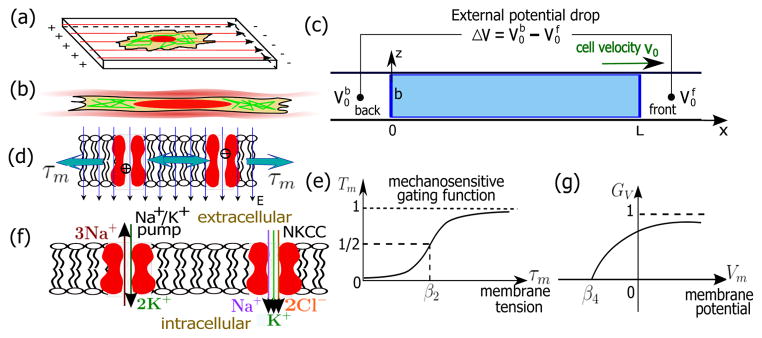
(Color online). Schematics of the model and membrane channels in cells. (a) Cartoon of a 2-D cell under an electric field. (b) Cartoon of a confined 1-D cell in a microchannel. (c) Diagram and the coordinate system of a 1-D cell model in an applied external voltage drop, ΔV. The coordinate system moves with the cell so that x ∈ [0, L] represent the cell body. z ∈ [0, b] in the width direction. is the extracellular electric potential at the back/front of the cell. The cell velocity is assumed positive when the cell moves towards the positive x–direction. (d) Schematics of the tension-gated passive channels that transport ions along the potential difference across the membrane. (e) The mechanosensitive gating function, Tm, follows a Boltzmann distribution and ranges from 0 to 1. (f) Cartoons of the Na+/K+ pumps and Na+-K+-Cl− cotransporters (NKCC). (g) Voltage dependence function, GV, of the Na+/K+ pumps that ranges from 0 to 1.

