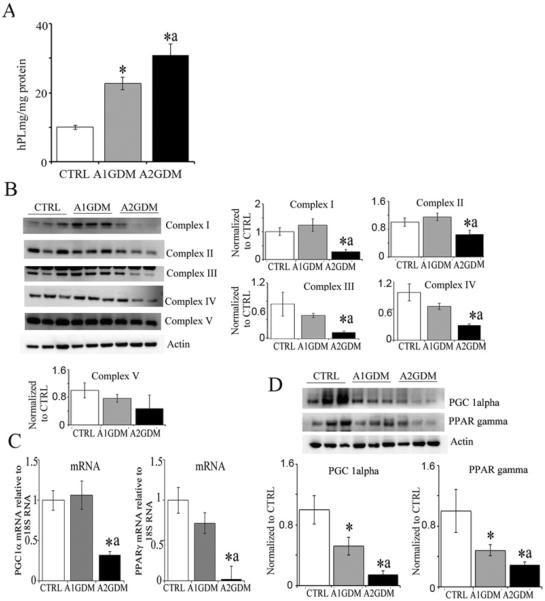
Figure 1. Dysregulation of mitochondrial function in GDM placentae.
(A) hPL levels measured in placental tissue homogenates. (B) Representative Western blots and quantification of mitochondrial complex protein expression in placental tissue. (C) mRNA expression of PGC1α and PPARγ in placental villous tissue relative to 18S RNA. (D) Representative Western blot and quantification of PGC1α and PPARγ expression relative to actin. Values are mean ± S.E.M., n = 6 in each group. *P<0.05 compared with CTRL and aP<0.05 compared with A1GDM.

