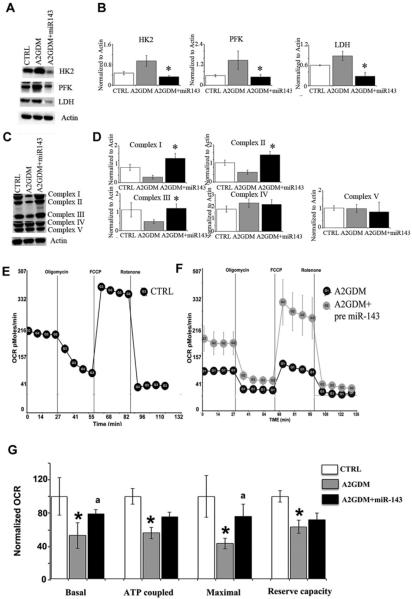
Figure 5. miR-143 overexpression reduces expression of glycolytic enzymes and rescues mitochondrial function in trophoblast cells of A2GDM.
(A) Representative immunoblots and (B) quantification of glycolytic enzyme expression in trophoblast cells of CTRL and of A2GDM with and without overexpression of miR-143, n = 4. (C) Representative immunoblots and (D) quantification of mitochondrial complex expression in trophoblast cells of CTRL and of A2GDM with or without overexpression of miR-143. n = 3 for complex I and n = 4 for complexes II–V, Values are mean ± S.E.M. *P<0.05 compared with CTRL, aP<0.05 compared with A2GDM. Mitochondrial respiratory parameters were measured in ST of (E) CTRL and (F) A2GDM pregnancies with or without miR-143. OCR were measured using a Seahorse Bioscience XF24 extracellular flux analyser as described previously [21]. (G) OCR values for each respiration parameter in A2GDM with or without miR-143 were normalized to values in CTRL cells. n = 4 placentas in each group. Values are mean ± S.E.M. *P< 0.05 compared with CTRL, aP<0.05 compared with A2GDM.

