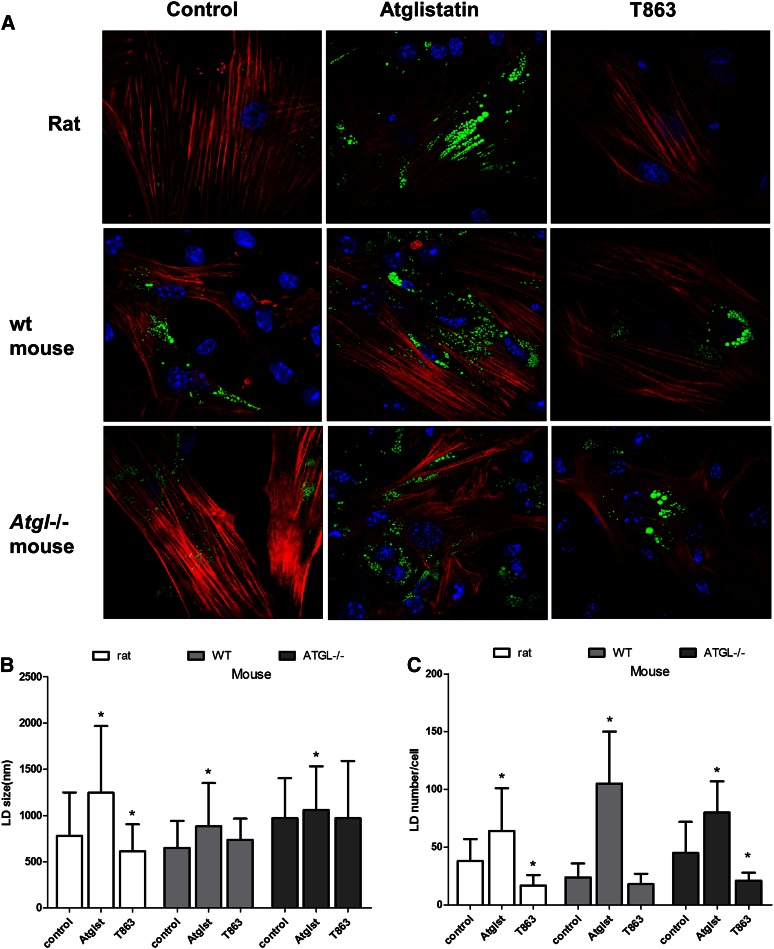
Fig. 5.
Effect of Atglistatin and the DGAT1 inhibitor, T863, on LDs and on the activation marker, α-SMA, in rat and mouse HSCs. A: Confocal images of HSCs isolated from rats and WT or Atgl −/− mice, which were incubated from day 1 to day 7 with vehicle (DMSO; control), 50 μM Atglistatin (Atglst), or 20 μM T863. LDs were stained with LD540 dye (green), anti α-SMA antibody (red), and nuclei were stained with Hoechst (blue). Shown are representative pictures from three experiments. B, C: Images were analyzed with CellProfiler v2.1.1. B: LD size was expressed in diameter (nanometers). C: LD numbers were expressed as a ratio of scored LDs and scored nuclei per image. Image analysis of rat HSCs was based on 40 cells and 2,500 LDs per condition and for mouse HSCs, both WT and Atgl−/− animals, on 85 cells and 3,000 LDs per condition. Data are the mean ± SD. *P < 0.05 t-test versus control.

