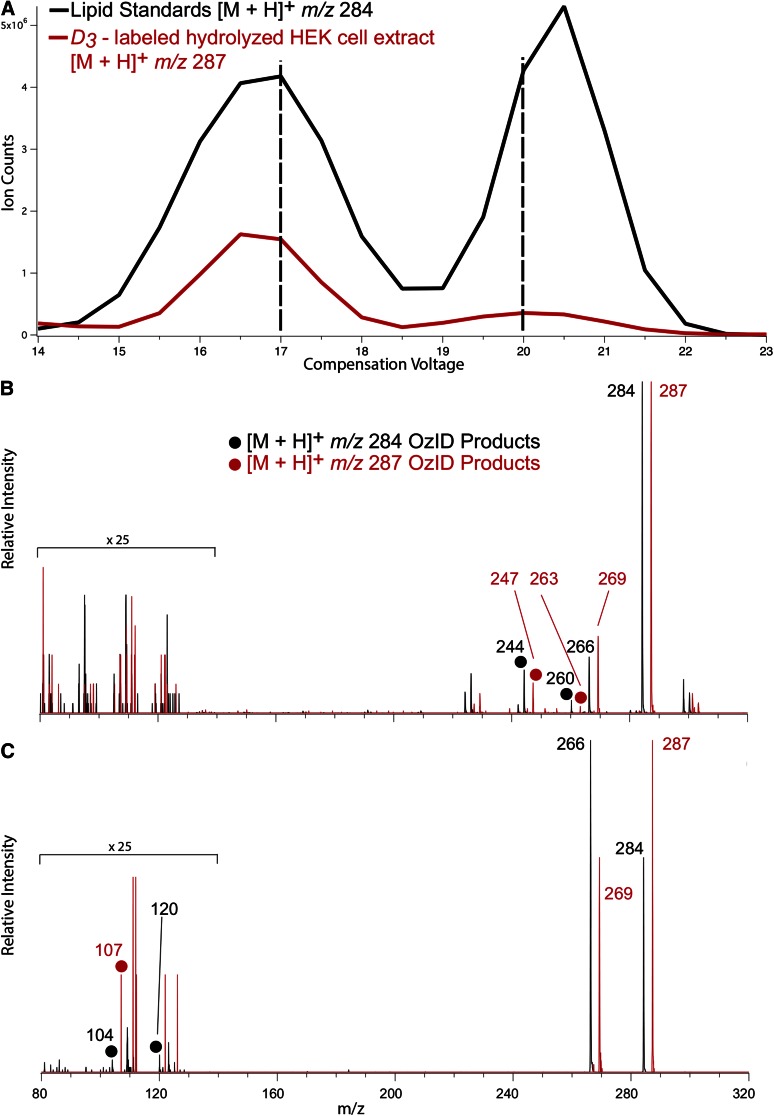
Fig. 3.
ESI(+) was undertaken on a mixture of D3-labeled hydrolyzed HEK cell lipid extracts spiked with unlabeled synthetic standards, SPH m18:1(4E)(3OH) and SPH m18:1(14E)(3OH). A: Ionograms showing separation in voltage space of the [M+H]+ ions formed from the two lipid isomers. Each of the synthetic lipids spiked into the extract produced a peak in the black trace (m/z 284) and similar features were observed for the labeled HEK293 extract shown in the red trace (m/z 287). B: OzID spectra obtained for synthetic standard (black spectrum) and the D3-labeled extract (red spectrum) corresponding to the first feature in the ionogram (i.e., CV = 17 V ozone reaction time of 100 ms). C: OzID spectra obtained for synthetic standard (black spectrum) and the D3-labeled extract (red spectrum) corresponding to the second feature in the ionogram (i.e., CV = 20 V ozone reaction time of 15 s). OzID product ions characteristic of the locations of the carbon-carbon double bonds are indicated by closed circles and enable assignment of the position of unsaturation to (Δ14)-position (B) and (Δ4)-position (C).

