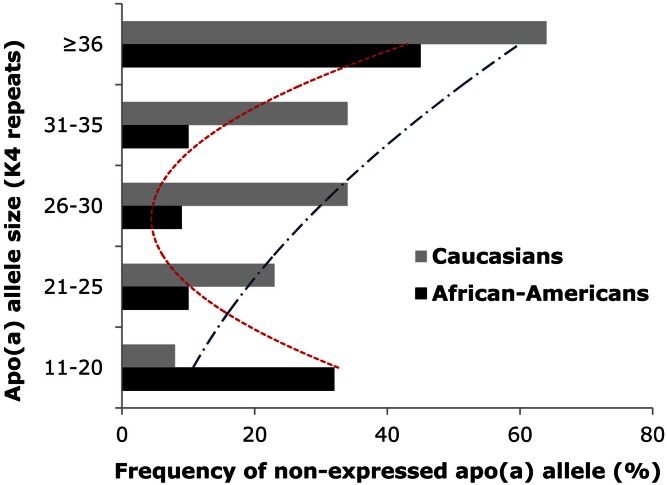
Fig. 1.
Frequency distributions of nonexpressed apo(a) alleles across apo(a) size ranges in African-Americans and Caucasians. In general, within an individual, the larger apo(a) isoform is more likely to be nonexpressed at the protein level than the smaller isoform. This trend is more apparent in Caucasians with a gradual rise in the nonexpressed allele frequency with an increasing number of KIV repeats (21). Among African-Americans, a more U-shaped distribution was observed.

