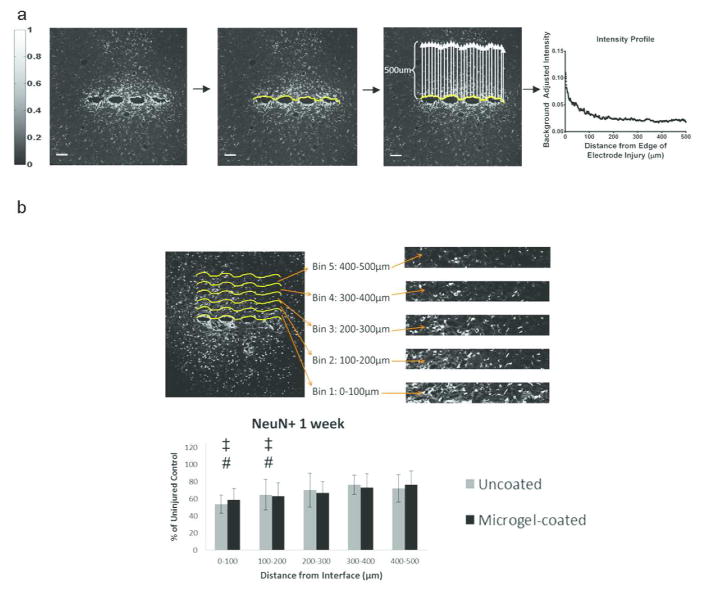
Figure 3.
Analysis of immunostaining was performed using a custom MATLAB program. (a) The IHC images for each sample of GFAP, OX42, or ED1 stained sections were displayed and a curve generated along the edge of the scar formed by the electrode. A scale bar (left) indicates the intensity values of the staining from 0 (black) to 1 (white). The program determines the average of the intensity along the curve from 0–500μm away from the scar and generates an intensity curve as a function of distance. Sample intensity curve is shown from an uncoated electrode at 24 weeks for GFAP stain (a, right). This curve is fit with Equation 1 and parameters for each curve are compared between groups. Image processing for NeuN stained samples (b) involves dividing the 500 μm image into 5 equal-sized bins of 100 μm and counting NeuN positive cells in each bin. These NeuN+ cell counts are compared to the uninjured control from the contralateral hemisphere. Scale bar = 100 μm.

