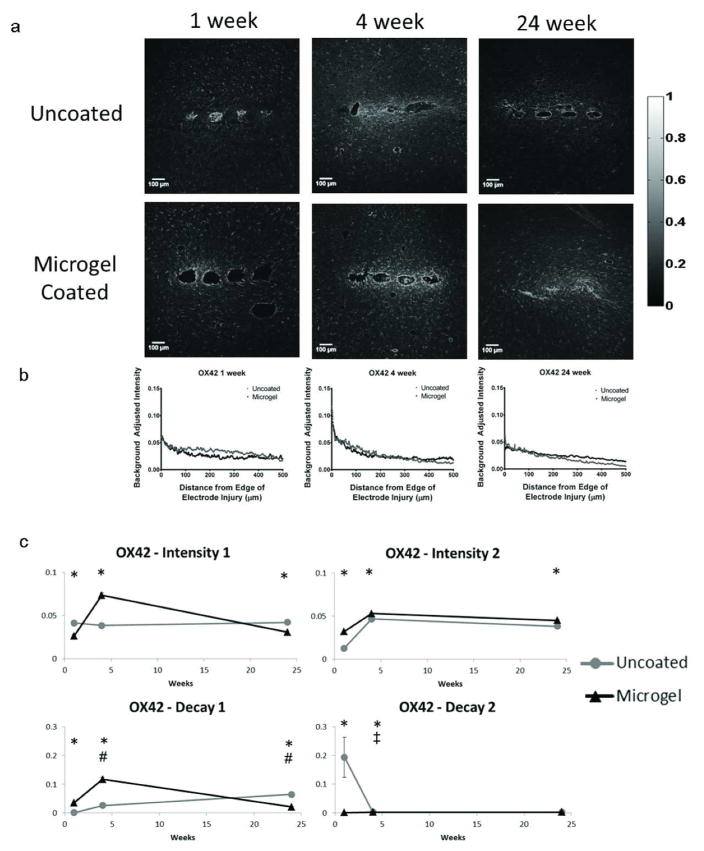
Figure 5.
Immunohistochemistry images and corresponding intensity scale (a) from each time point and group of samples stained with OX42 (CD11b), a marker for microglia. Representative intensity curves from background-corrected images (b) are located below the representative immunostaining images for each time point. Parameter curves (c) were generated in a similar manner to those for GFAP and indicate changes in intensity and decay values over time for the experimental groups. Symbols indicate: * significant differences between the groups at one time point, ‡ significant differences over time between the indicated and preceding time-point for uncoated samples, # significant differences over time between the indicated and preceding time-point for microgel-coated samples.

