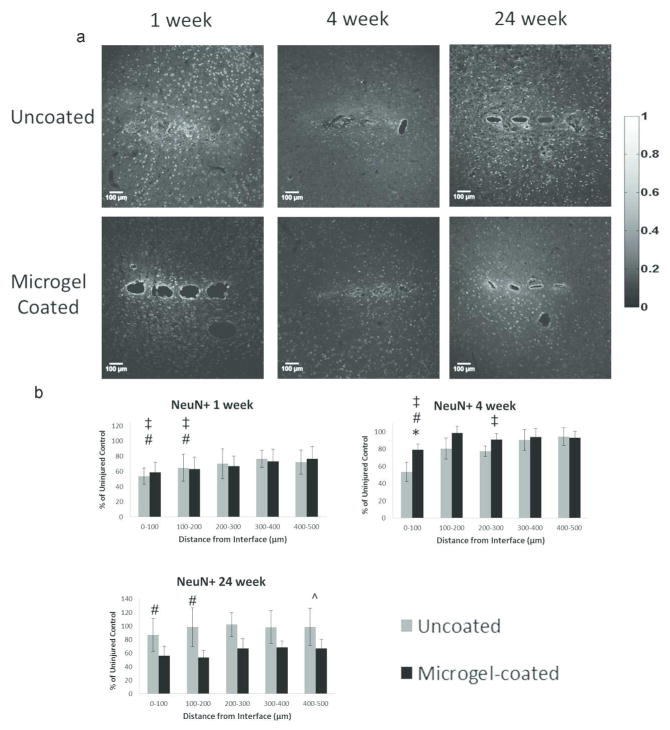
Figure 7.
Immunohistochemistry images (a) from each time point and experimental group stained with NeuN, a marker for neuronal. Graphs for each time point (b) indicate the average number of neuronal nuclei in each 100μm bin for uncoated and microgel-coated samples as a percentage of the cells found in the contralateral uninjured control. Symbols indicate: * significant differences between uncoated and microgel-coated samples, ‡ significant differences between uncoated and contralateral samples, # significant differences between microgel-coated and contralateral samples, ^ significant differences between the indicated and preceding time-point for microgel-coated samples.

