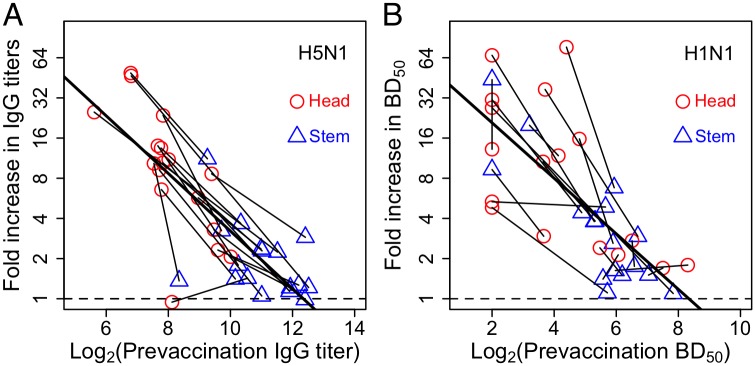
Fig 6. Analysis for how the fold increase in antibodies to the head and stem of HA depend on their pre-immune levels in individuals.
We plot lines obtained by joining the data for head and stem for individuals vaccinated with H5N1 (Panel A) and H1N1 (Panel B) (see Tables C and D in S1 Text). We find the slope of these lines is not significantly different from an average line using all the data (thick line). This result consistent with the EMM model, but inconsistent with the ACM and FIM models which predict the slopes of the individual lines should be zero. Also see corresponding Table 2.

