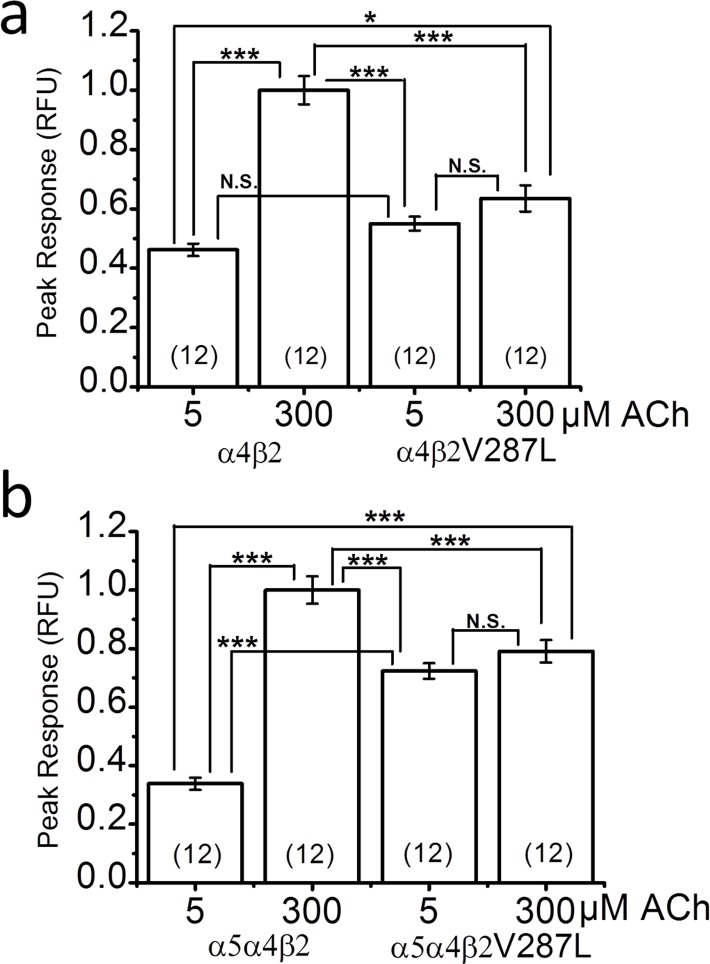
Fig 5. Fluorescent responses of α4β2, α4β2V287L, α5α4β2, and α5α4β2V287L nAChRs to 5 and 300 μM ACh.
ACh responses were measured using a membrane-potential-sensitive fluorescent dye. a. The bars are peak responses to 5 and 300 μM ACh of α4β2 (WT) and α4β2V287L (mutant) receptors (measured in relative fluorescent units (RFU)). HEK cells were transfected with α4 and β2 cDNA in a 1:1 stoichiometric ratio (w/w). The WT and mutant responses were measured in matched groups of cells transfected on the same day, incubated for the same time, and tested on the same day. All responses were normalized to the peak WT 300 μM ACh response. Sample sizes (n = number of culture wells) are given in parentheses inside the bars. Connecting lines above the bars in this, and subsequent, figures indicate statistical comparisons between various groups. Asterisks give the significance levels for post hoc comparisons between the groups. Not significant (N.S.) b. Similar analysis for HEK cells transfected with α5α4β2 (WT), or α5α4β2V287L (mutant), cDNA in a 1:1:1 α5:α4:β2 stoichiometric ratio.

