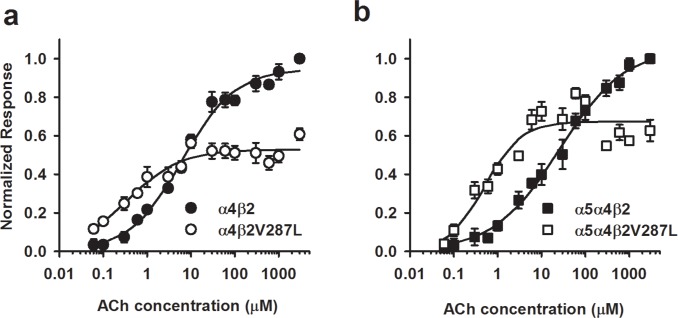
Fig 6. ACh concentration-response relations for α4β2, α4β2V287L, α5α4β2, and α5α4β2V287L nAChRs using a membrane-potential dye.
a. β2V287L shifted the α4β2 ACh concentration-response to the left and reduced the maximum response. The data were normalized to the 1 mM ACh α4β2 response. The filled circles are α4β2 responses, and the open circles, α4β2V287L responses. The lines are fits to the three-parameter Hill equation (see Table 2 for the fitted parameters). b. Co-expression with α5 increased the maximum response of cells transfected with the mutant receptor cDNA (α5α4β2V287L) relative to the WT control (α5α4β2). The data were normalized to the 1 mM ACh α5α4β2 response. The α5:α4:β2 cDNA transfection ratio was 1:1:1 (w/w). The filled squares are α5α4β2 responses, and the open squares, α5α4β2V287L responses. All else was the same as in a.

