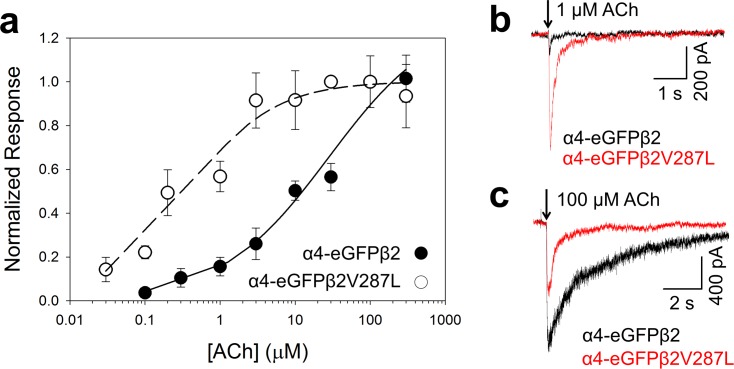
Fig 7. β2V287L increased the ACh sensitivity of α4β2 nAChRs in N2a cells but reduced maximum response.
The α4 subunit was labeled with an enhanced green fluorescent protein (eGFP) tag to facilitate the identification of cells expressing α4β2 nAChRs. The cells were voltage-clamped at -60 mV in whole-cell mode. a. Normalized ACh concentration-response relations for the α4-eGFPβ2 (filled circles) or α4-eGFPβ2V287L receptors (open circles). The α4-eGFPβ2 and α4-eGFPβ2V287L ACh responses were normalized to the peak 100 μM response. The α4-eGFPβ2 symbol at 100 μM ACh is obscured by that for α4-eGFPβ2V287L. The dashed (α4-eGFPβ2V287L) and solid lines (α4-eGFPβ2) are fits to the three-parameter Hill equation (see text for values of fitted parameters). b-c. Superimposed traces of α4-eGFPβ2 (black) and α4-eGFPβ2V287L (red) responses to 300 ms applications of 1 (b) and 100 μM ACh (c). At 1 μM ACh, the α4-eGFPβ2V287L response was larger than α4-eGFPβ2 response. At 100 μM ACh, it was smaller. Downward arrows denote the onset of a 300 ms ACh application.

