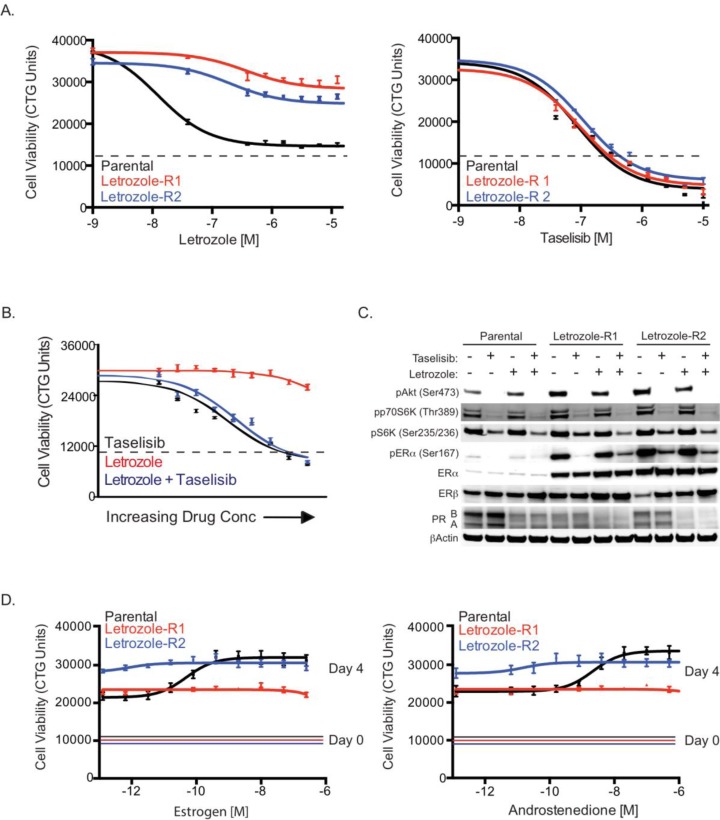
Figure 3. Characterization of letrozole resistant cells.
(A) MCF7-ARO parental or letrozole resistant cells treated with a dose titration of letrozole (left) or taselisib (right) and assayed for viability using CellTiter-Glo (CTG) 96 hrs post dosing. Dotted lines are indicative of CTG counts at the beginning of drug treatment. (B) Similar response to taselisib by itself or in combination with letrozole, in letrozole resistant cells. The effect on viability of taselisib and letrozole as single agents is shown in the black and red lines, respectively. The combination effect of the two drugs is indicated with the blue line. Dotted lines are indicative of CTG counts at the beginning of drug treatment. (C) Letrozole resistant cells have increased ERα. Treatments are for 24 hrs with 0.1 μM taselisib and/or 0.1μM letrozole. (D) Resistant cells do not increase proliferation in response to estrogen. MCF7-ARO parental or letrozole resistant cells cultured with a dose titration of androstenedione (right) or estrogen (left) and assayed for viability using CellTiter-Glo after 96 hrs. Solid lines are indicative of CTG counts prior to estrogen or androstenedione treatment. Error bars indicate standard deviation around the mean.

