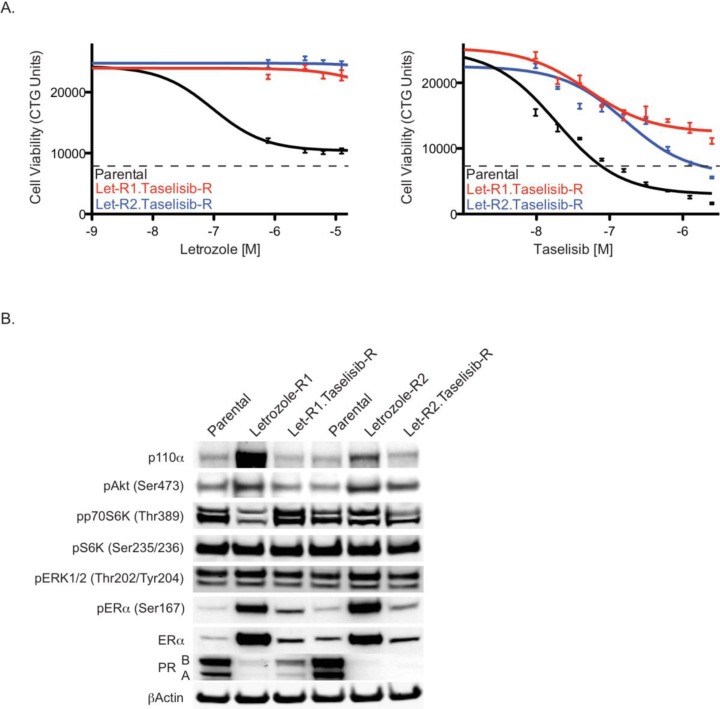
Figure 4. Characterization of cells resistant to both letrozole and taselisib.
(A) MCF7-ARO parental or taselisib/letrozole resistant cells treated with a dose titration of letrozole (left) or taselisib (right) and assayed for viability using CellTiter-Glo 96 hrs post dosing. (B) Protein changes with the acquisition of resistance to letrozole or dual resistance to letrozole and taselisib, compared to parental MCF7-ARO. Cell lysates were prepared and analyzed by immunoblotting for the markers indicated. Dotted lines for all viability data are indicative of CTG counts at the beginning of drug treatment. Error bars indicate standard deviation around the mean.

