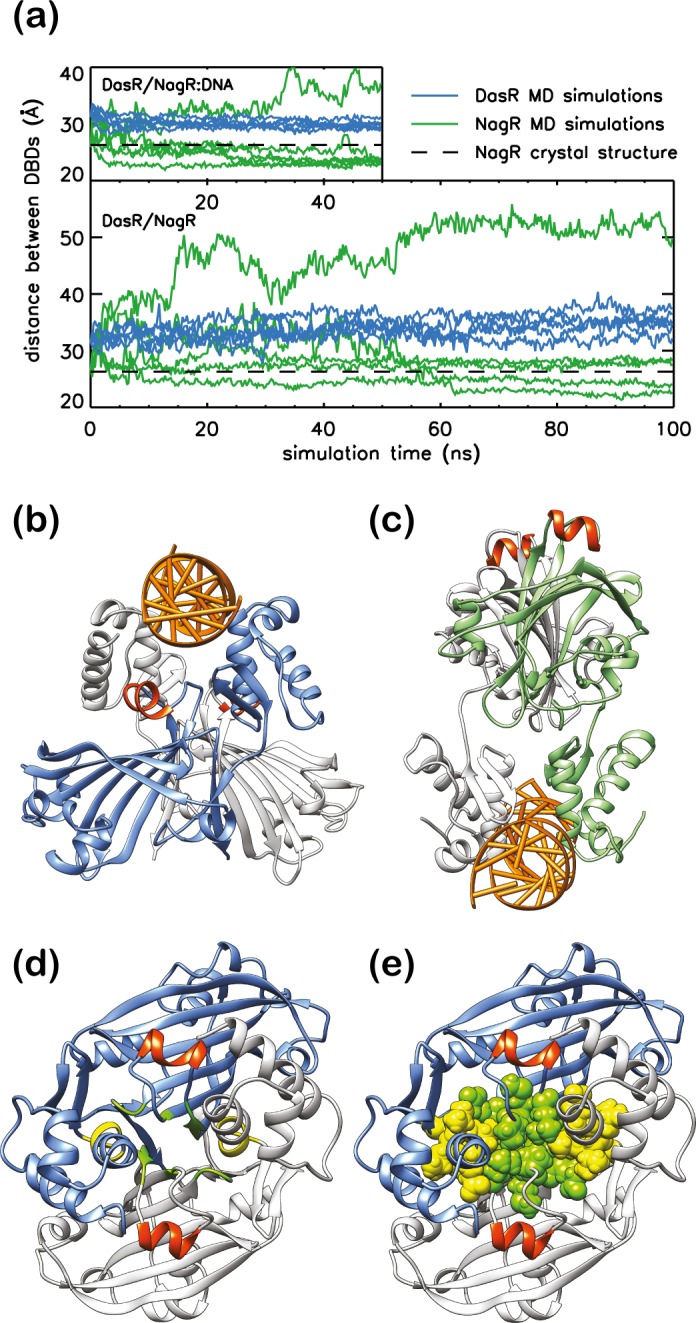
Fig 8. Impeded rapprochement of the DBDs in DasR.

(a) DBD-COM distance of DasR (blue) and NagR (green) during MD simulations. While the upper plot displays the MD simulations performed in the presence of DNA, the lower plot shows the results from MD simulations in the absence of any DNA. The black dashed lines indicate the DBD-COM distance in the dre-site bound NagR crystal structure. Comparison of (b) a simulation snapshot of DasR bound to DNA and (c) the NagR-DNA complex crystal structure. DasR monomers are shown in blue and light grey, NagR monomers in green and light grey. Helices αE6 are coloured in orange red. (d) and (e) DasR in the ‘upwards’-directed conformation after 50 ns simulation time. Residues Thr197, Ser198, Leu199, Pro215, Met216, Gly240 and Asp241 are coloured in green, while residues Glu67, Leu68, Val69, Val70 and Glu71 are highlighted in yellow. In (e), the interaction-patch-forming residues are shown as spheres for further clarity.
