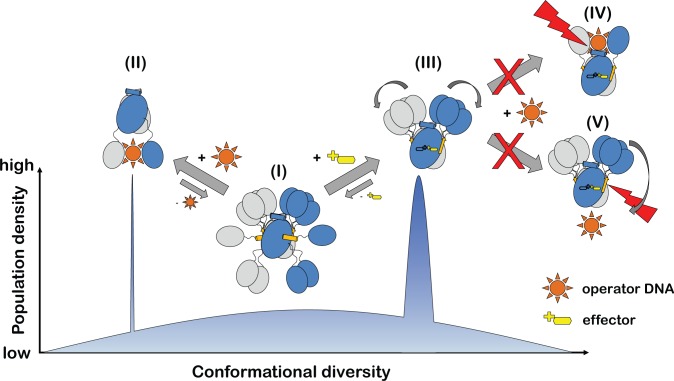
Fig 10. A conformational selection model best describes the allosteric regulation of GntR/HutC transcription factors.
The population density of distinct functional states is schematically compared to the conformational diversity observed in GntR/HutC crystal structures. The different functional states are (I) effector- and DNA-free repressor, (II) DNA-bound repressor and (III) effector-bound repressor. Effector-bound repressors cannot bind DNA in the conformations depicted in (IV) and (V).

