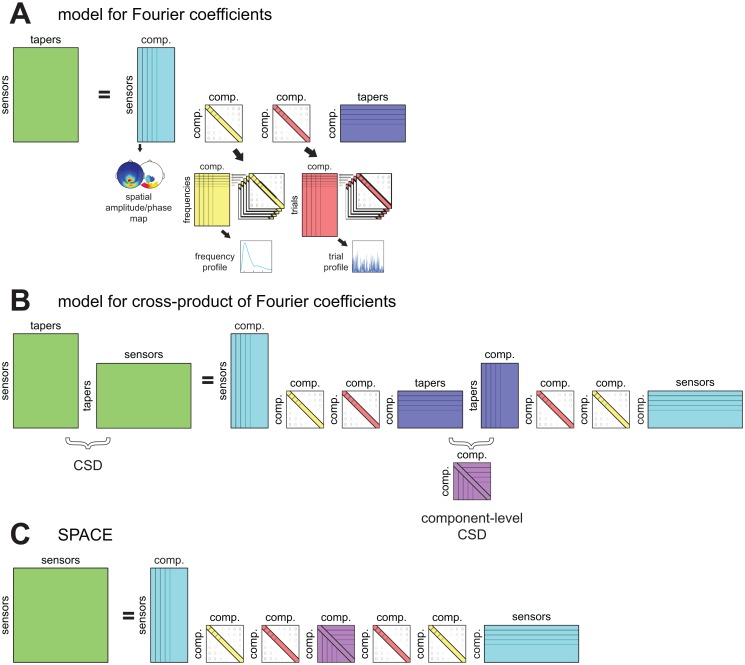
Fig 1. A model for characterizing between-sensor phase coupling by rhythmic components.
Our method is based on a model that describes patterns of between-sensor phase coupling of oscillations in electrophysiological recordings. These oscillations are described by Fourier coefficients obtained by a spectral analysis using multitapering, which vary of sensors, tapers, frequencies and trials. Components describe the systematic variability in these Fourier coefficients by a spatial amplitude map, a spatial phase map per frequency, a frequency profile, and a trial profile (see Fig 2 for examples). Here we present the model schematically. We start with a model for the observed Fourier coefficients in A, continue with a model for its cross-product in B, and end with the model we use for extracting components in C. A. This model describes the structure in sensor-by-taper matrices of Fourier coefficients (green) per frequency and trial, by the product of four matrices reflecting the four parameter sets. The first (cyan) is complex-valued and contains the spatial amplitude map (see Fig 2B) and frequency-specific spatial phase map (see Fig 2C) for all components. The second matrix (yellow) is real-valued and diagonal, and contains the frequency-specific weighting of components. When combined over frequencies, it forms the frequency profile (see Fig 2A). The third matrix (red) is similar to the second (cyan) but contains the trial-specific loadings, and forms the trial profile (see Fig 2D). The fourth matrix (blue) is complex-valued, and contains the frequency- and trial-specific amplitudes and phases of each taper of each component. B. This is a model for the cross products of the matrices of Fourier coefficients. These cross products are the cross-spectral density matrices (CSDs), and describe between-sensor phase coupling averaged over tapers. The model for the cross products is the cross product of the model in A, and contains the same parameters. In the center there are now the component-by-component cross products of the matrices (purple) that contained taper-specific parameters. Importantly, these component-by-component cross products describe the phase coupling between components averaged over tapers, and is the component-level CSD. This matrix is explicitly modeled in the final model which we use to extract components. C. The final model explicitly models between-component phase coupling by the component-level CSD (purple). Importantly, this is only estimated per frequency, and not per trial and per frequency (see Materials and Methods for a mathematical description of the model). Components according to this model can be extracted using a method denoted as SPACE.

