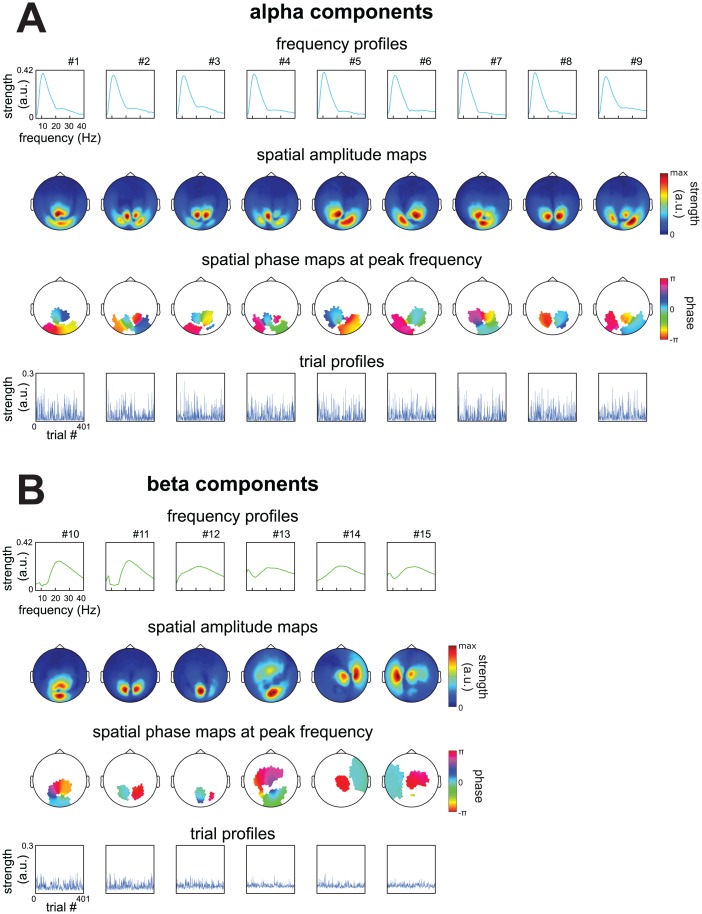
Fig 4. Spatial and spectral structure of sources described by 15 components from a representative subject.
We extracted 15 components using the analysis pipeline described in Materials and Methods from MEG recordings of a representative subject performing a cued tactile detection task (see Materials and Methods). This dataset came from the prestimulus period. A, frequency profiles, spatial amplitude maps, spatial phase maps at the peak frequency, and trial profiles of components reflecting alpha sources. Phases in the spatial phase maps were masked when amplitudes in the spatial amplitude map fell below 30% of its maximum. B, same as A, but for components reflecting beta sources. The components we extracted consisted of (1) many overlapping posterior alpha components, (2) posterior beta components, (3) an occipito-central/frontal component and (4) left and right sensorimotor beta components. Components reflected different types of sources, for a discussion see Results and Sections 1,2 and 3 in S1 File.

