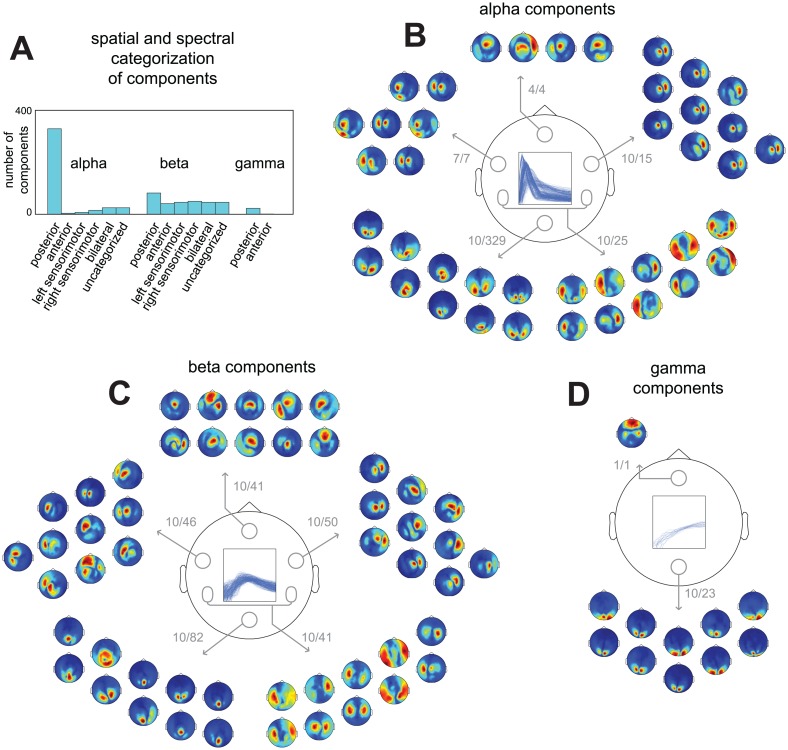
Fig 6. Spatial and spectral diversity of sources described by 783 components extracted from MEG recordings during a cued tactile detection task.
783 components were extracted using the analysis pipeline present in Fig 3 from MEG recordings of 11 subjects in 22 sessions performing a cued tactile detection task, split into 3 trial periods, resulting in 66 datasets. Per dataset we extracted on average 12.0 (SD = 2.0) components, explaining on average 50.7% (SD = 6.5%) of the variance in its CSDs. Based on their frequency profiles we classified 423 components as alpha, 332 as beta, and 28 as gamma components. To visualize their spatial diversity we categorized components based on the distribution of their spatial amplitude maps in 6 categories, describing posterior, anterior, left sensorimotor, right sensorimotor, and bilateral components, and a rest category (see Materials and Methods). A, summary of spatial and spectral categorization. B, 10 exemplars of alpha components from each spatial category (see Materials and Methods). Numbers indicate the selected and the total number of components in each category. C, same as in B but for beta components. D, same as in B but for gamma components. From A-D we observe that the extracted components consisted of (1) posterior alpha, beta, and gamma components, (2) sensorimotor alpha and beta components, and (3) some deep (or distributed superficial) alpha but mostly beta components (anterior and bilateral regions).

