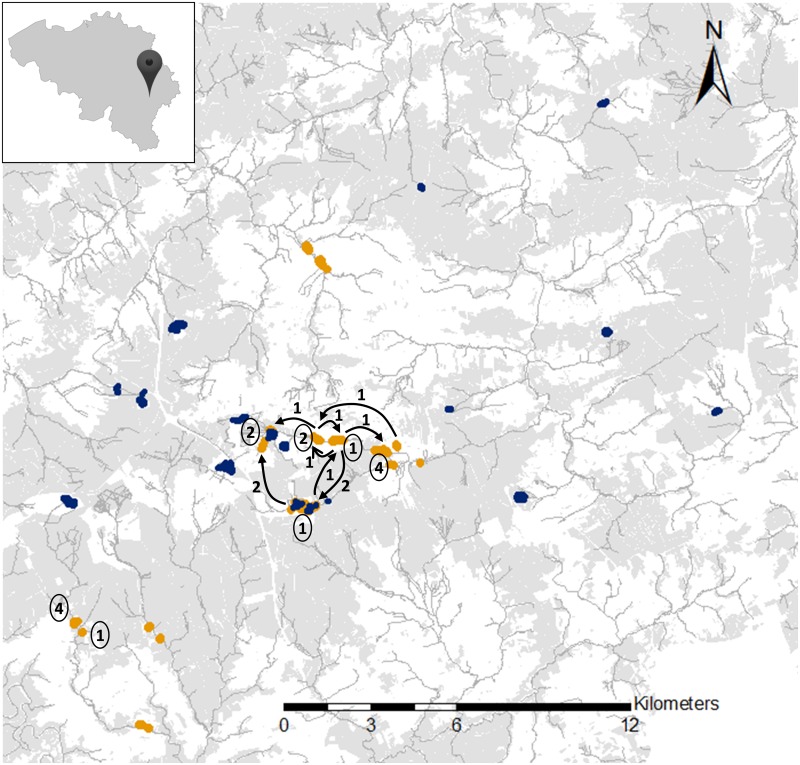
Fig 1. Map of the studied populations of both Boloria butterfly species in south-eastern Belgium (insert).
Dark blue areas = B. aquilonaris populations. Light orange areas = B. eunomia populations. Black arrows and corresponding numbers = direction and number of movements of the B. eunomia dispersers. Circled numbers = Location and number of B. eunomia residents.

