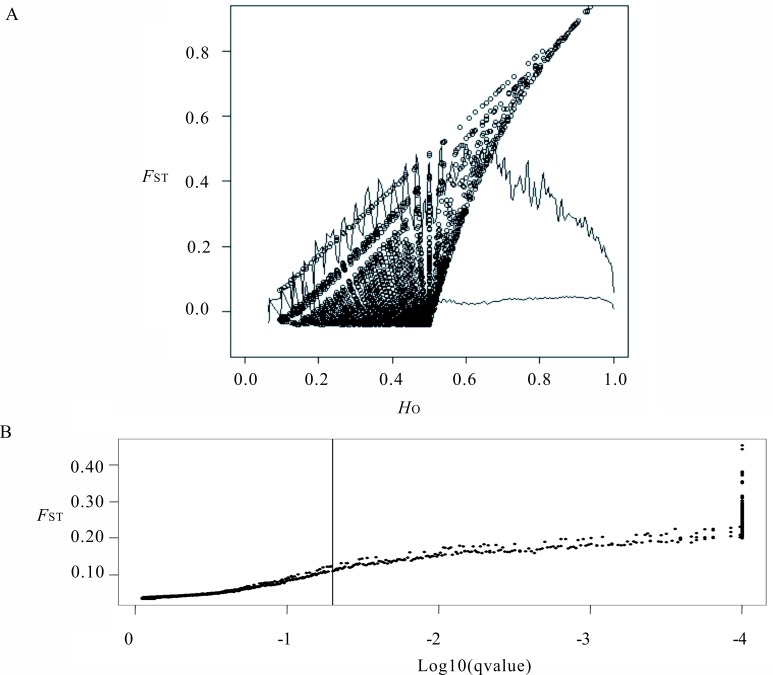
Fig 2. Graphical representation of outlier tests results.
(A) results from the LOSITAN. Above the top line is a 0.995 probability for being candidates of selection. A subset of the loci between the two lines is within 0.005–0.995 probability and is considered neutral. The remaining SNPs are conservatively considered undetermined. (B) results from BAYESCAN. The vertical line represents a false discovery threshold of 0.05. The candidate loci under directional selection are on the right side of the vertical line.

