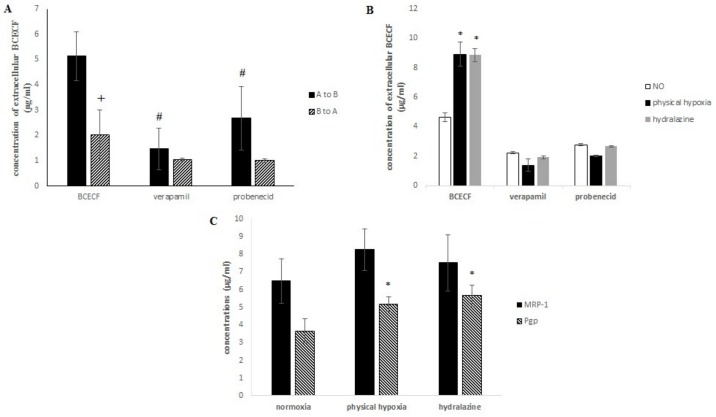
Fig 7.
(A) Transport of BCECF by Pgp and MRP-1 from compartment A to B or B to A. (B) Release of BCECF during transport from A to B after hydralazine or physical hypoxia exposure. (C) Concentrations of MRP-1 and Pgp after cells of the BBB model were exposed to 100 μM hydralazine, or 2% 02 during 2 h. Results are presented as mean value ± s.e.m (n = 3). # P < 0.05 BCECF vs. inhibitors and* P < 0.05 normoxia vs. treatment.

