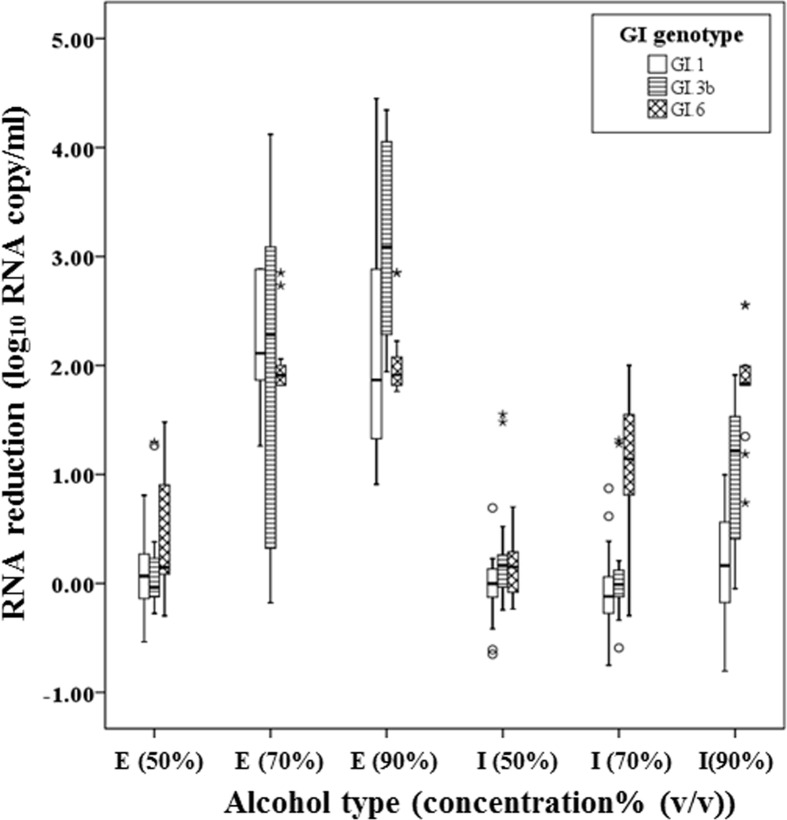
Fig 1. Virolysis patterns of GI.1, GI.3b and GI.6 norovirus strains after exposure to ethanol (E) and isopropyl alcohol (I) at 3 different concentrations (50%, 70%, and 90%).
3 GI.1, 4 GI.3b and 4 GI.4 strains with three replicate per each were consolidated by genotype and were expressed as a box plot. The upper, lower ends of the box and the horizontal line in the box indicate the first (Q1), third quantiles (Q3) and median value of all data, respectively. The lower and higher ends of whiskers indicate the minimum and maximum value of all data, respectively. Isolated data points are outliers.

