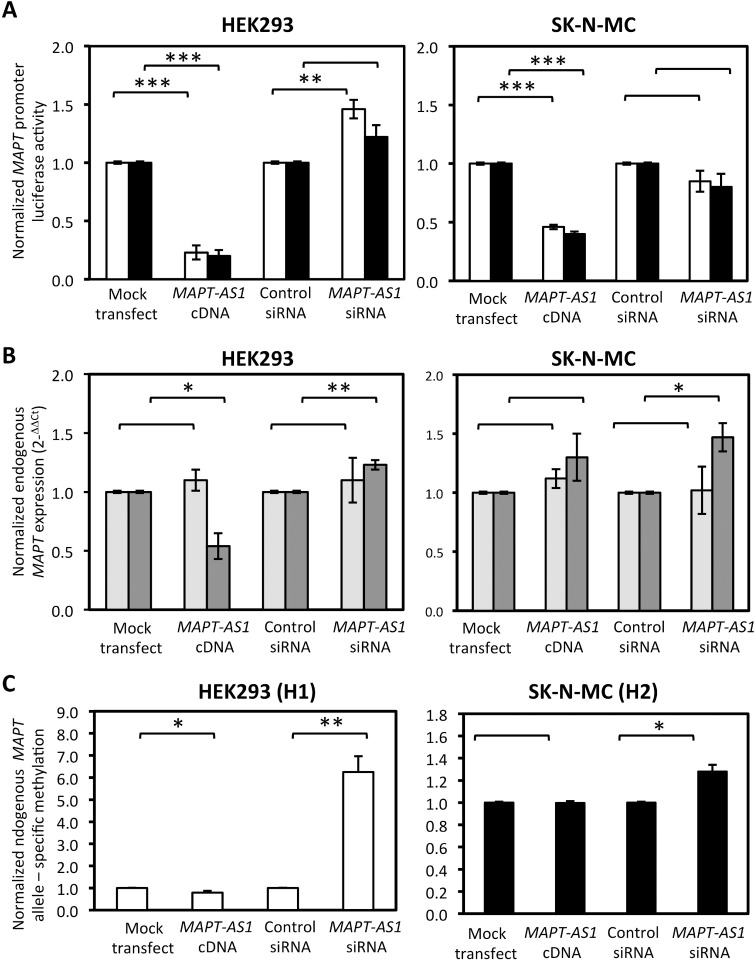
Fig 2. Effect of MAPT-AS1 over- and knock-down expression on MAPT expression in HEK293 and SK-N-MC cells.
A) H1 (white columns) and H2 (black columns) haplotype MAPT promoter-driven luciferase activity. Luciferase activity is normalized to each control transfection levels. B) Endogenous transcript levels of either total MAPT (light grey columns) or 4 repeat MAPT transcript (dark grey columns). Transcript levels are normalized to each control transfection levels C) Endogenous haplotype-specific DNA methylation with H1 (white columns) and H2 (black columns) specific data indicated. Methylation levels from MAPT-AS1 over- or under-expression are normalized to control transfection levels. Error bars indicate standard error of the mean from 5 independent experiments. *, p < 0.05; *** p < 0.0001.

