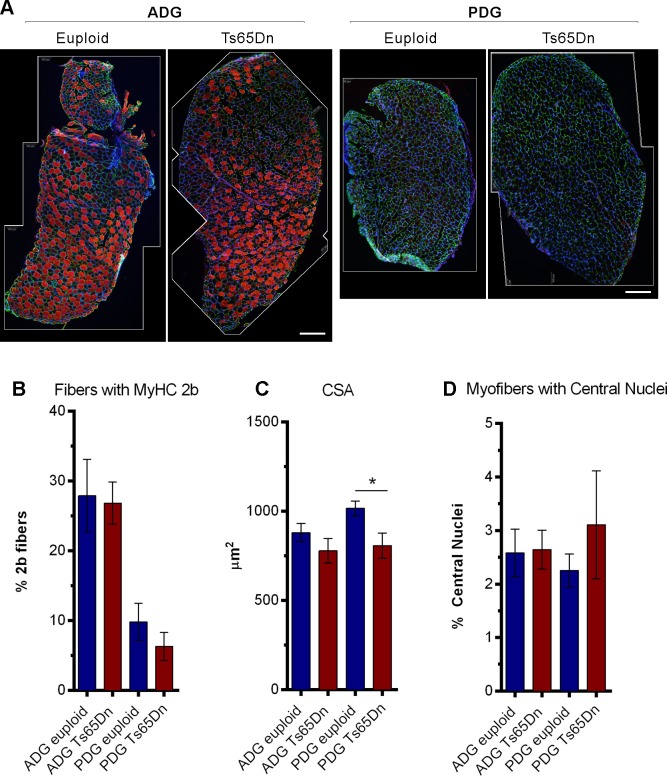
Fig 3. Immunofluorescence staining of thin sections.
A) Anterior (ADG) and posterior (PDG) digastric muscle cross sections. Photomontage borders are indicated in white. MyHC 2b (Red), Laminin (Green), Nuclei (Blue). Scale: 200 μm. B) Percentage of myofibers staining positive for MyHC 2b. n = 5–7 per group. Mean and SEM. C) Cross-sectional area of myofibers. n = 4–6 per group. Mean and SEM D) Percentage of myofibers positive for centralized nuclei. n = 6–7 per group. Mean and SEM.

