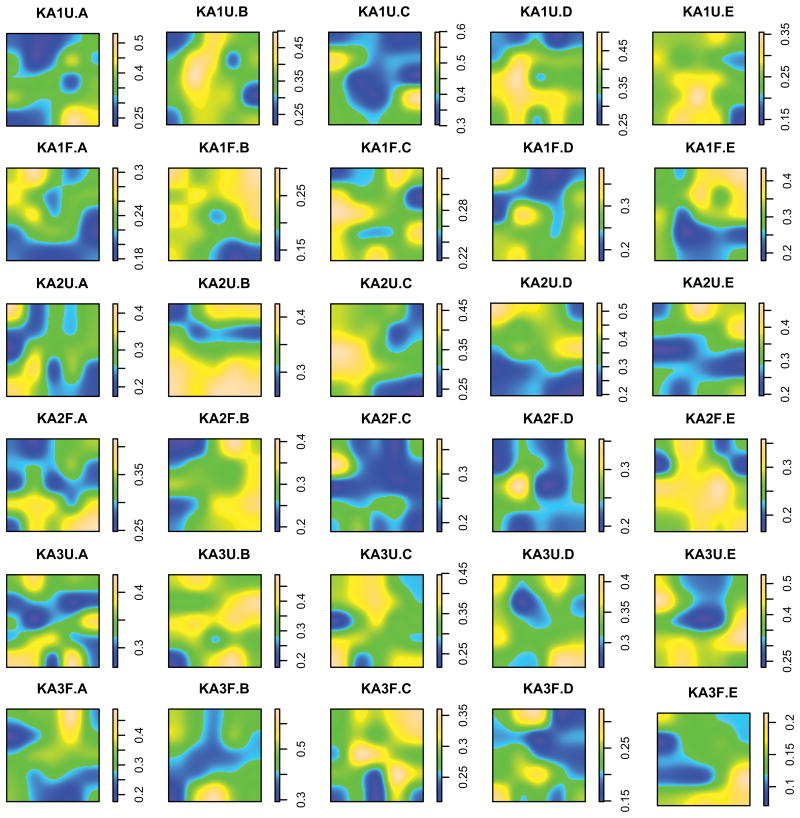
Figure 1.
Spatially explicit, heatmaps representing relative abundance of Verrucomicrobia in thirty 10 cm × 10 cm sampling grids. Values between sampling points were interpolated based on ordinary kriging. Blue represents areas of relatively low abundance, and yellow represents areas of relatively high abundance.

