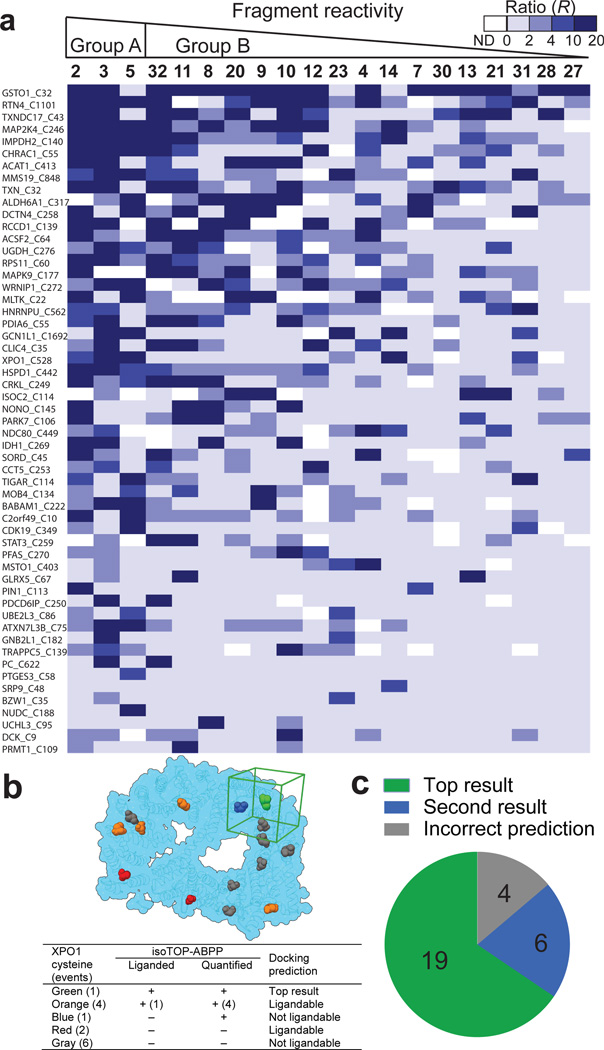
Figure 3. Analysis of fragment-cysteine interactions.
a, Heatmap showing R values for representative cysteines and fragments organized by proteomic reactivity values (high to low, left to right) and percentage of fragment hits for individual cysteines (high to low, top to bottom). R values ≥ 4 designate fragment hits (colored medium and dark blue). White color – not detected (ND). b, Representative example of reactive docking predictions shown for XPO1 (PDB ID: 3GB8). All accessible cysteines were identified and reactive docking was conducted with all fragments from the library within a 25 Å docking cube centered on each accessible cysteine (cube shown in green for liganded Cys in XPO1; see Supplementary Information for more details). Legend presents categories of XPO1 cysteines based on combined docking and isoTOP-ABPP results. c, Success rate of reactive docking predictions for liganded cysteines identified by isoTOP-ABPP for 29 representative proteins.

