
Extended Data Figure 2. Analysis of proteomic reactivities of fragment electrophiles in human cell lysates.
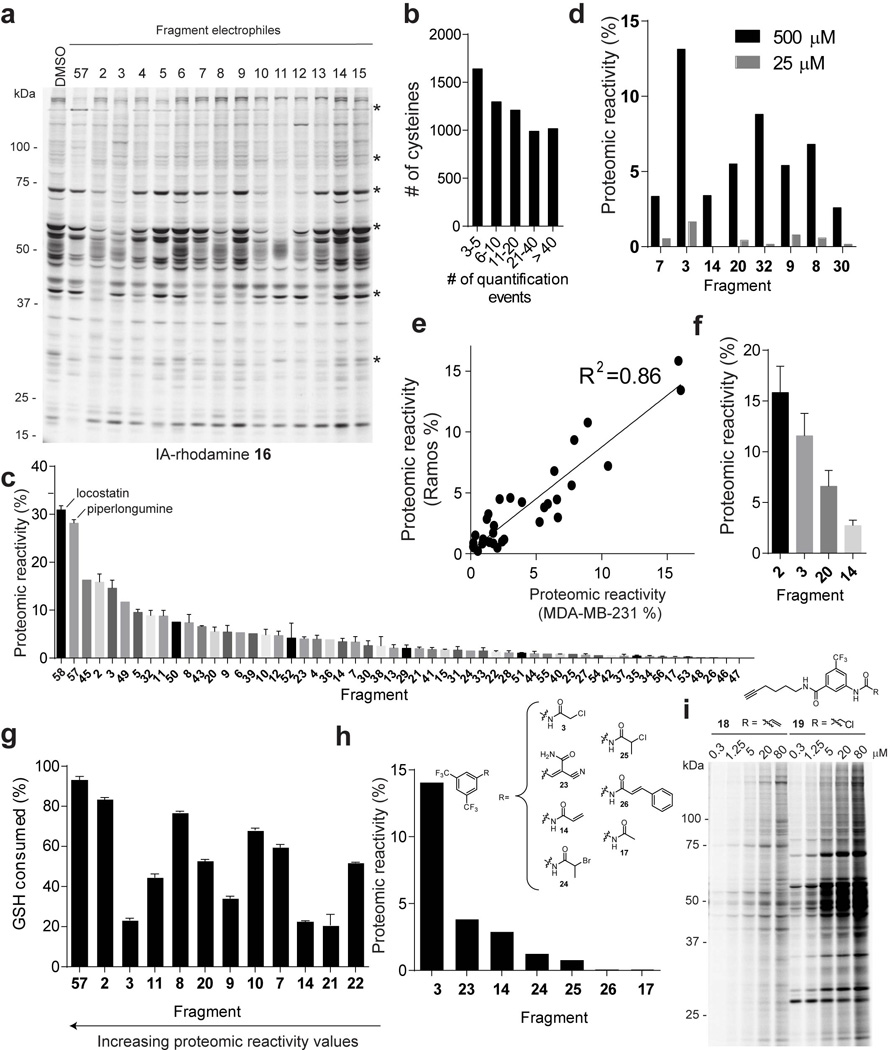
a, Initial analysis of the proteomic reactivity of fragments using an IA-rhodamine probe 16. Soluble proteome from Ramos cells was treated with the indicated fragments (500 µM each) for 1 h, followed by labeling with IA-rhodamine (1 µM, 1 h) and analysis by SDS-PAGE and in-gel fluorescence scanning. Several proteins were identified that show impaired reactivity with IA-rhodamine in the presence of one or more fragments (asterisks). Fluorescent gel shown in grayscale. b, Frequency of quantification of all cysteines across the complete set of competitive isoTOP-ABPP experiments performed with fragment electrophiles. Note that cysteines were required to have been quantified in at least three isoTOP-ABPP data sets for interpretation. c, Rank order of proteomic reactivity values (or liganded cysteine rates) of fragments calculated as the percentage of all quantified cysteines with R values ≥ 4 for each fragment. The majority of fragments were evaluated in 2–4 replicate experiments in MDA-MB-231 and/or Ramos cell lysates, and their proteomic reactivity values are reported as mean ± SEM values for the replicates. d, Comparison of the proteomic reactivities of representative fragments screened at 500 versus 25 µM in cell lysates. e, Comparison of proteomic reactivity values for fragments tested in both Ramos and MDA-MB-231 lysates. f, Proteomic reactivity values of representative fragments. g, Relative GSH reactivity for representative fragment electrophiles. Consumption of GSH (125 µM) was measured using Ellman’s reagent (5 mM) after 1 h incubation with the indicated fragments (500 µM). h, Proteomic reactivity values for fragments electrophiles (500 µM) possessing different electrophilic groups attached to a common binding element. i, Concentration-dependent labeling of MDA-MB-231 soluble proteomes with acrylamide 18 and chloroacetamide 19 click probes detected by CuACC with a rhodamine-azide tag and analysis by SDS-PAGE and in-gel fluorescence scanning. For panels f and g, data represent mean values ± SEM for at least three independent experiments.