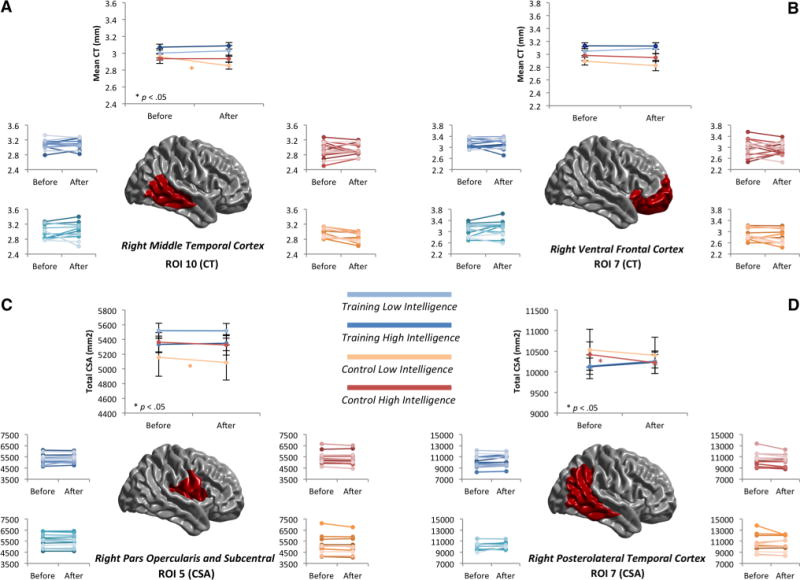
Fig. 4.

a Interaction analysis (Group × Intelligence × ROI): ROI 10–Cortical Thickness. Top panel shows the mean change in each group. Bottom panel shows the changes for each participant. Colors show different groups: dark blue (high intelligence-training group), light blue (low intelligence-training group), red (high intelligence-control group) and orange (low intelligence-control group). b Interaction analysis (Group × Intelligence × ROI): ROI 7–Cortical Thickness. Top panel shows the mean changes in each group. Bottom panel shows the changes for each participant. Colors show different groups: dark blue (high intelligence-training group), light blue (low intelligence-training group), red (high intelligence control group) and orange (low intelligence-control group). c Interaction analysis (Group × Intelligence × ROI): ROI 5–Cortical Surface Area. Top panel shows the mean changes in each group. Bottom panel shows the changes for each participant. Colors show different groups: dark blue (high intelligence training group), blue (low intelligence training group), red (high intelligence control group) and orange (low intelligence control group). d Interaction analysis (Group × Intelligence × ROI): ROI 7–Cortical Surface Area. Top panel shows the mean changes in each group. Bottom panel shows the changes for each participant. Colors show different groups: dark blue (high intelligence training group), blue (low intelligence training group), red (high intelligence control group) and orange (low intelligence control group)
