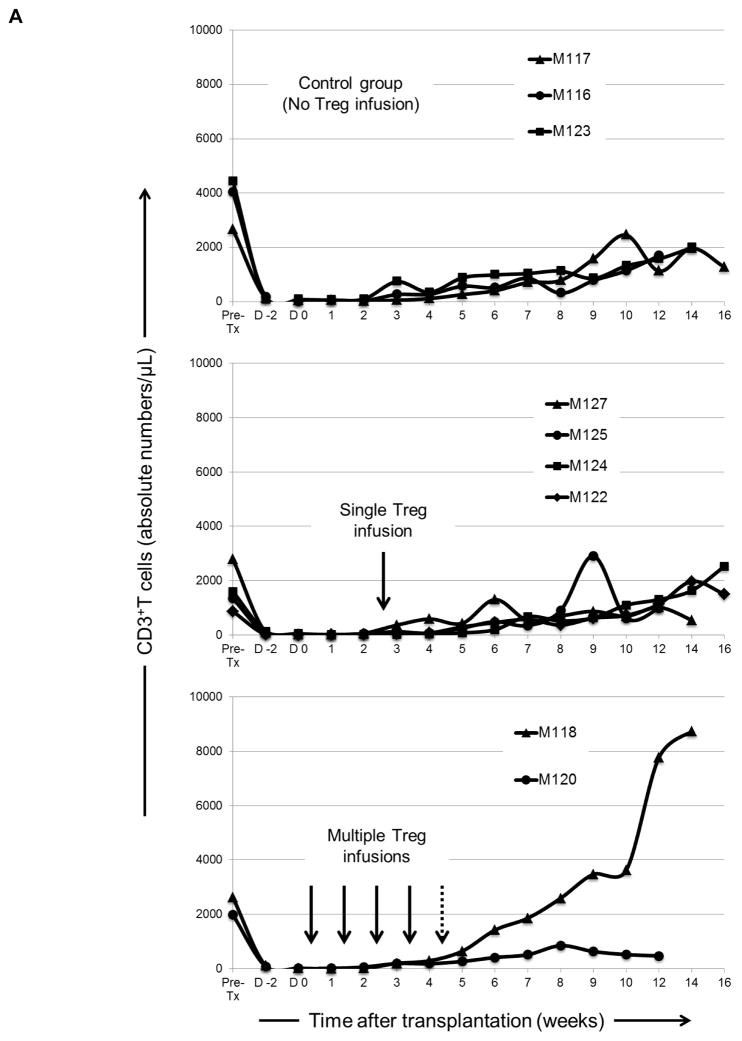
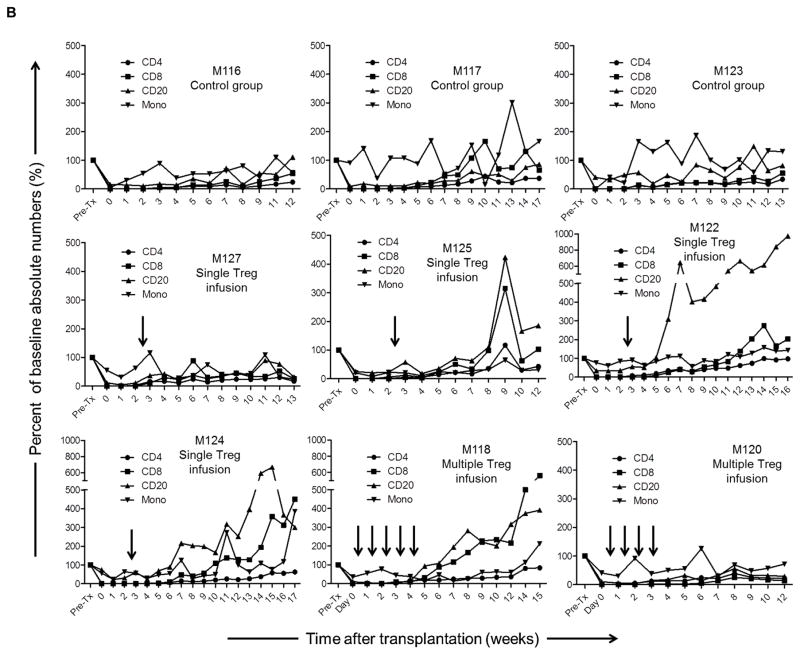
Figure 4. Kinetics of peripheral blood T and B cell and monocyte numbers in lymphodepleted control and Treg-infused heart allograft recipients.
(A) Kinetics of CD3+ T cell depletion and recovery in individual monkeys. (B) Absolute numbers of CD4+ and CD8+ T cells, CD20+ B cells, and monocytes in individual monkeys at various times pre-transplant and post-transplant. Vertical arrows denote the time(s) of Treg infusion(s).


