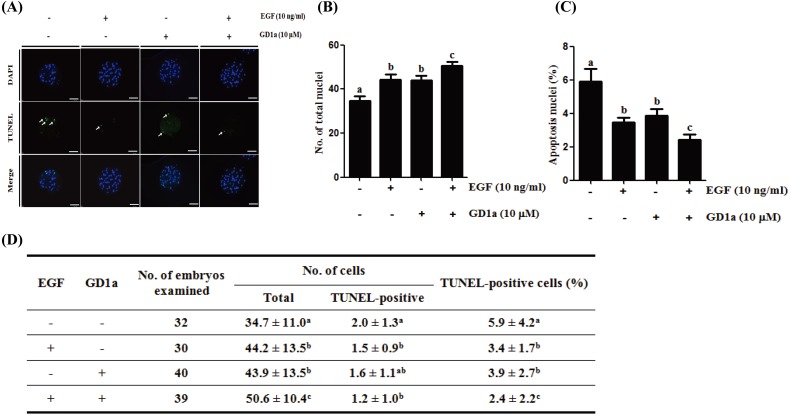
Fig. 6.
Apoptosis scanning images of porcine blastocysts derived from EGF and/or GD1a treated oocytes. (A) The chromatin content was determined by DAPI staining (total DNA, blue); fragmented DNA was detected by TUNEL assay (apoptotic nuclei, green). Scale bars = 100 μm. (B) Total cell number and (C) percent of apoptotic cells in porcine blastocyst-stage embryos after EGF and/or GD1a treatment. (D) Summary of developmental competence. This experiment was replicated at three times. Data are the means ± SD. Different superscript letters denote significant differences (P < 0.05).

