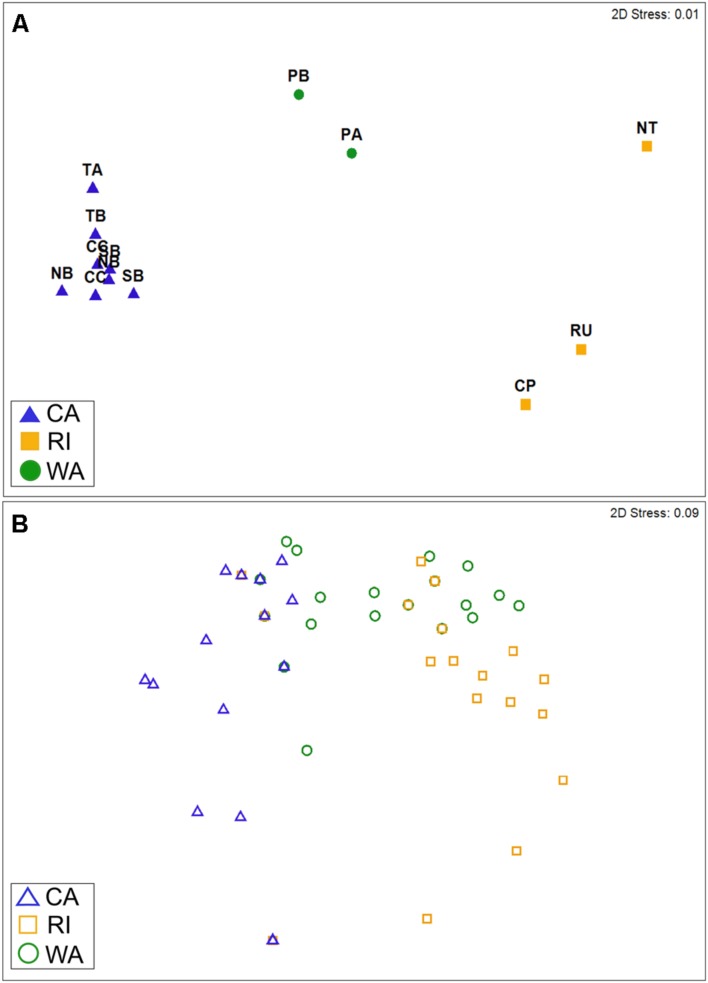
FIGURE 2.
Non-metric multi-dimensional scaling plots depicting similarity in cyanomyovirus isolates by geographic location based on (A) taxonomic composition (Bray–Curtis similarity of OTU composition) or (B) host range phenotypes. (A) Points represent the OTU composition of isolated cyanomyoviruses in each site. For CA, multiple points for each site represent different sampling dates. (B) Points represent the host range of individual isolates (n = 213) and are shown as open symbols to clarify overlaps (many isolates had identical host range profiles and therefore are completely overlapping in the plot). In both panels, points that are farther apart are more dissimilar from each other in terms of their OTU composition (A) or host range phenotype (B).

