
Figure 4.
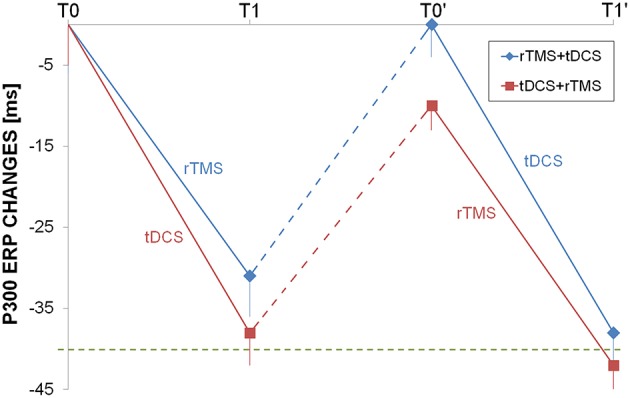
Longitudinal auditory evoked potential evaluation. P300 changes from baseline were shown for rTMS+tDCS (blue diamonds) and tDCS+rTMS (red squares) groups. Dotted blue and red lines indicated washout. The dotted green line was at 40 ms improvement as reference. Abbreviations as in Figure 1.