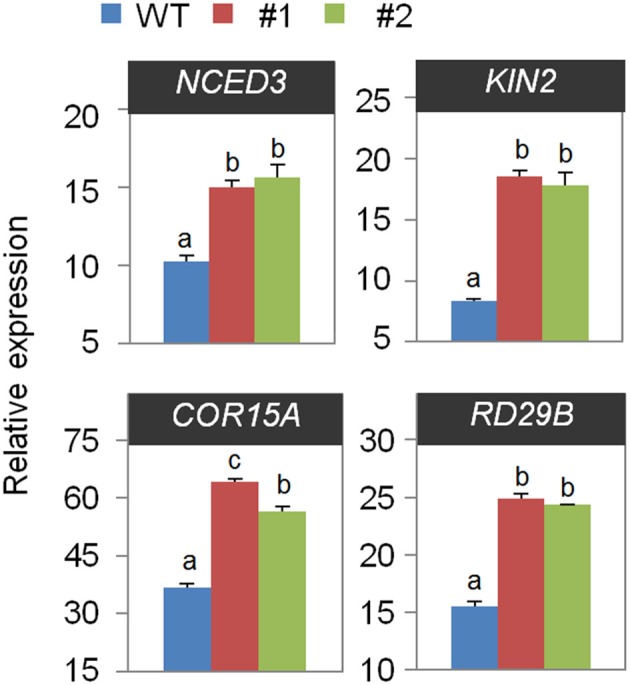
Figure 6.

Quantitative reverse transcription polymerase chain reaction (qRT-PCR) analysis of drought-inducible genes in the CaOSR1-OX mutant exposed to drought stress at 6 h after detachment. The relative expression levels (ΔΔCT) of each gene were normalized to the geometric mean of Actin8 as an internal control gene. Data represent the mean ± standard error of three independent experiments. Different letters indicate significant differences between wild-type and transgenic lines (P < 0.05; ANOVA followed by Fisher's LSD test).
