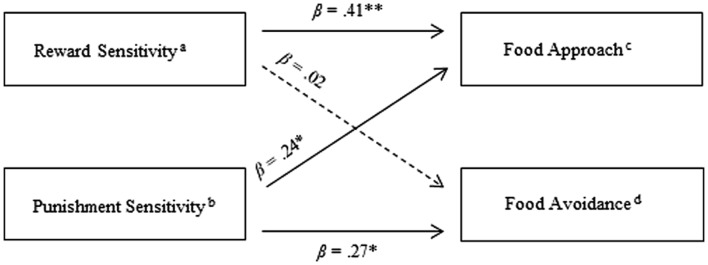
FIGURE 1.
Summary of independent hierarchical regression analyses for Reward and Punishment Sensitivity predicting Food Approach and Food Avoidance. ∗p < 0.05, ∗∗p < 0.01; a Component score of BAS_Total and SPSRQ-RS; b Component score of BIS_Total and SPSRQ-PS; c Component score of FApB, External Eating, Emotional Eating and the Power of Food Scale; d Component score of FAvB and CFNS.

