
Figure 1.
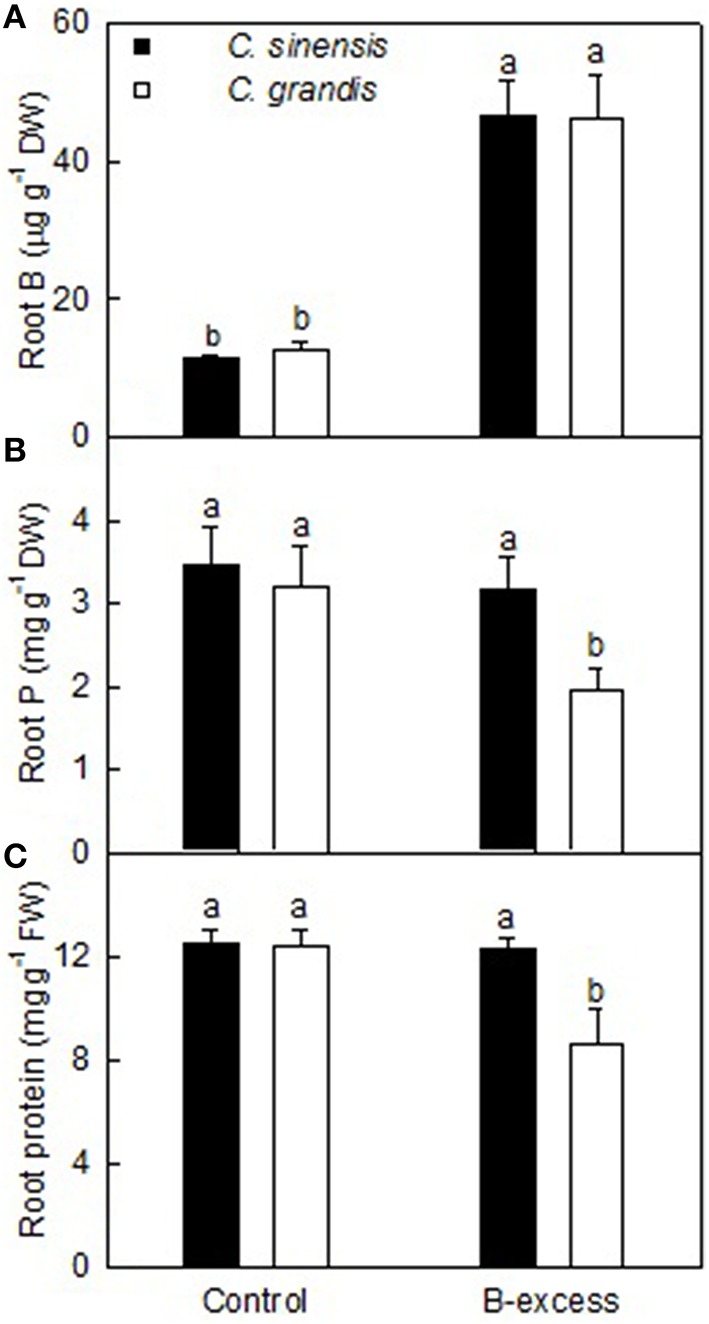
Effects of B-excess on root B (A), P (B), and total soluble protein (C) concentrations. Bars represent means ± SD (n = 4). Different letters above the bars indicate a significant difference at P < 0.05.
Official websites use .gov
A
.gov website belongs to an official
government organization in the United States.
Secure .gov websites use HTTPS
A lock (
) or https:// means you've safely
connected to the .gov website. Share sensitive
information only on official, secure websites.
Effects of B-excess on root B (A), P (B), and total soluble protein (C) concentrations. Bars represent means ± SD (n = 4). Different letters above the bars indicate a significant difference at P < 0.05.