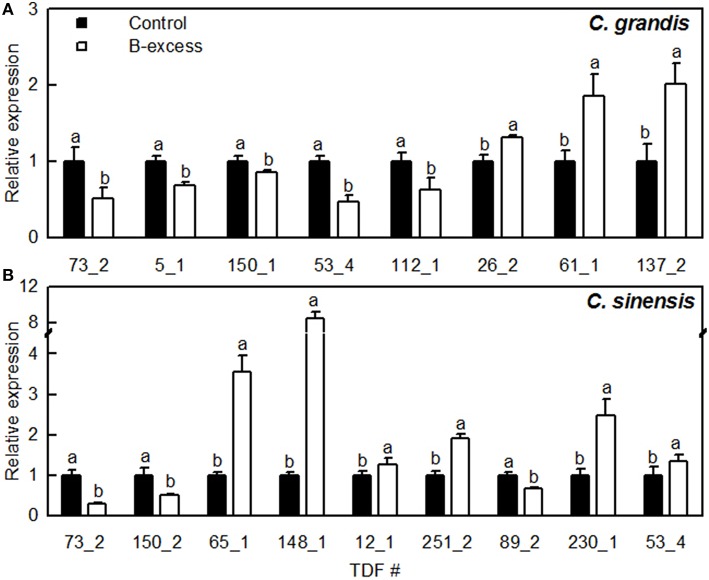
Figure 4.
Relative expression levels of TDFs from Citrus grandis (A) and Citrus sinensis (B) roots. qRT-PCR was run in three biological replicates with two technical replicates. Citrus actin (GU911361.1) was employed as an internal standard, and roots from control plants were used as a reference sample (set as 1). Bars represent means ± SD. Different letters above the bars indicate a significant difference at P < 0.05.

