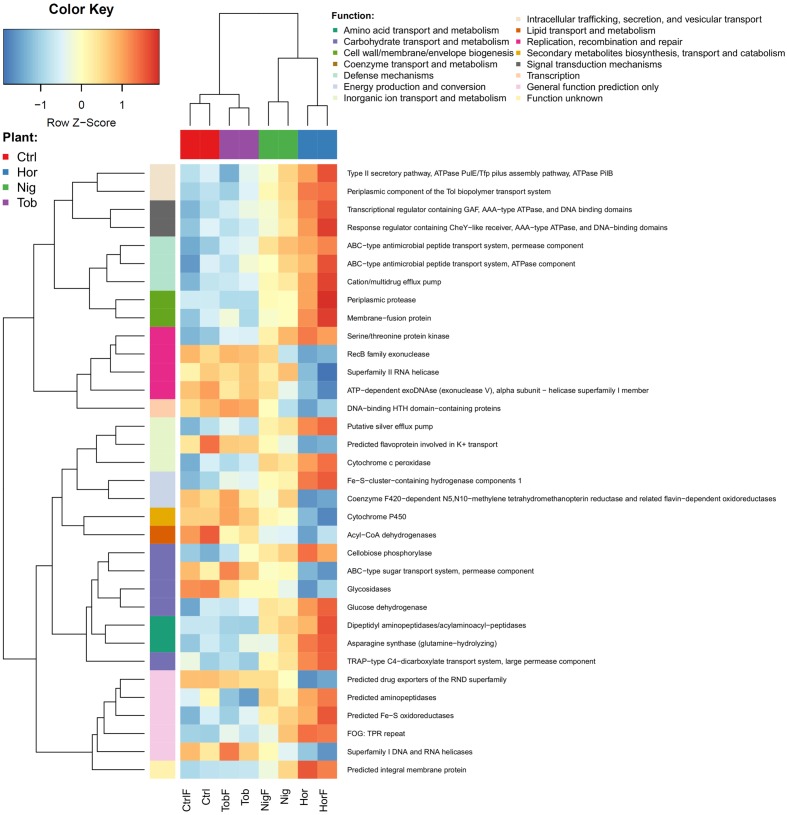
FIGURE 4.
Differences in the functional potential in the soil samples as determined by annotating metagenomic reads using COG database Level 3. Abbreviations correspond to those in Figure 1. As in Figure 3, rlog-normalized read counts of each functional group were scaled to have zero mean and unit standard deviation.

