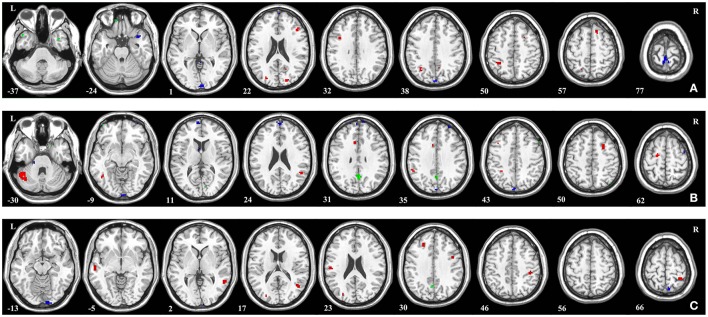
Figure 3.
Brain regions that showed the highest discriminative value for the classification in (A) PTSD and HC, (B) TEC and HC, and (C) PTSD and TEC. Regions were identified by setting the threshold to 30% of the maximum (absolute) weight value. Red, blue, and green colors indicate the most discriminative regions of GMV, ALFF, and ReHo features, respectively.

