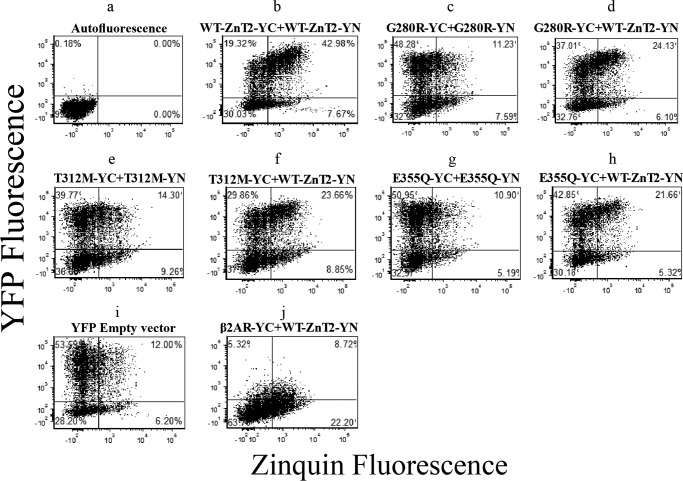
FIGURE 3.
Flow cytometry dot-plot analysis was undertaken to assess the functionality of the ZnT2 mutants. Shown are flow cytometry dot-plots from one representative experiment. MCF-7 cells were transiently co-transfected with the constructs described above the dot-plots. The y-axis represents the YFP fluorescence, whereas the x-axis denotes Zinquin fluorescence levels. Each dot represents a single cell. Quadrants were determined using the autofluorescence dot-plot. Upper quadrants represent all cells displaying an YFP fluorescence level that was above the autofluorescence signal (transfected cells). Right quadrants represent all cells displaying Zinquin fluorescence. Upper-right quadrants represent cells exhibiting both YFP signal and Zinquin staining.

