
FIGURE 4.
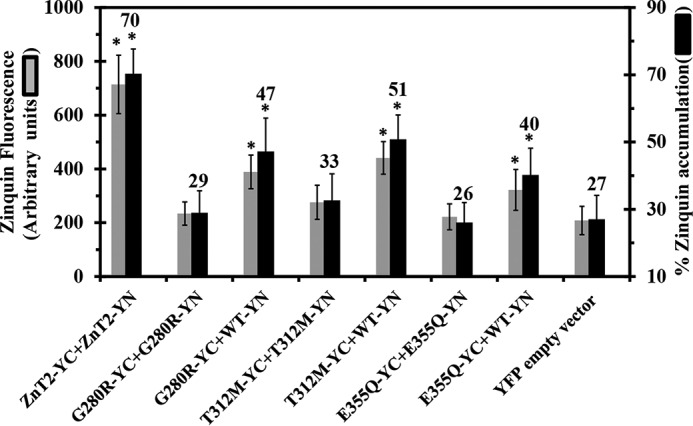
Zinquin accumulation assay reveals the disruption of zinc transport function in various ZnT2 mutants associated with TNZD. MCF-7 cells co-transfected with the constructs depicted along the x axis were examined for Zinquin fluorescence levels (gray bars) as well as the percentage of transfected cells displaying Zinquin fluorescence (dark bars). The percentage of Zinquin accumulation was calculated by dividing the fraction of YFP fluorescent cells (YC-YN) displaying Zinquin fluorescence by the total fraction of cells displaying YFP fluorescence (YC-YN). Asterisks indicate that the values obtained were significantly different (p < 0.05) when compared with the YFP empty vector. Error bars represent S.D.