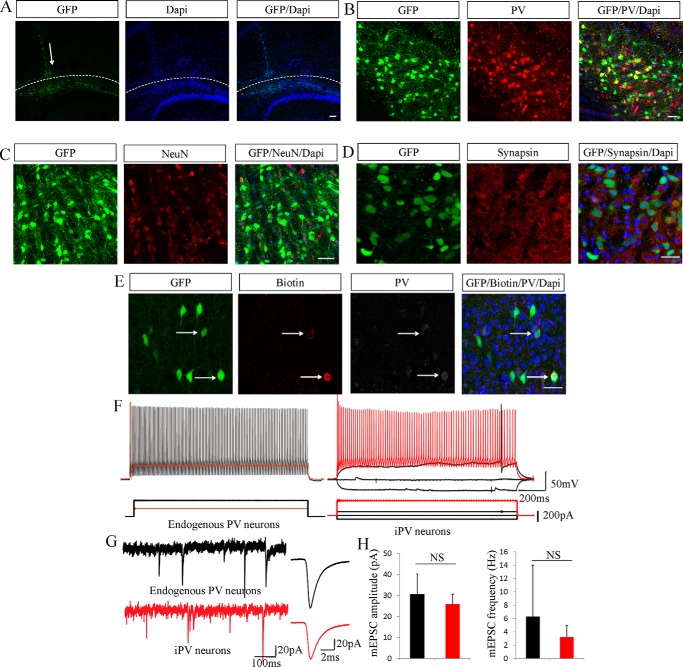
FIGURE 5.
iPV neurons integrate into hippocampal dentate gyrus neural networks in vivo. A, a schematic diagram represents iN cell transplant position, and arrows denote grafted GFP+ cells in the hippocampal dentate gyrus after transplantation. green, GFP; blue, DAPI. B–D, 2–4 weeks after transplantation iN cells mature and express PV, NeuN, and synapsin. E, the grafted cells that had been electrophysiologically recorded were examined for the expression of PV. F, the action potentials showed high frequency discharges, sharp spikes, and high thresholds. G, the miniature PSCs were recorded in grafted cells in vivo. The red bar represents iPV neuron electrophysiological signals, and the black bar shows endogenous PV neurons. H, the amplitude and frequency of iPV neurons miniature PSCs were similar to endogenous PV neurons. The data are presented as the mean ± S.E. of the cell counts. Scale bars: 100 μm (A) and 50 μm (B–E). NS, not significant.

