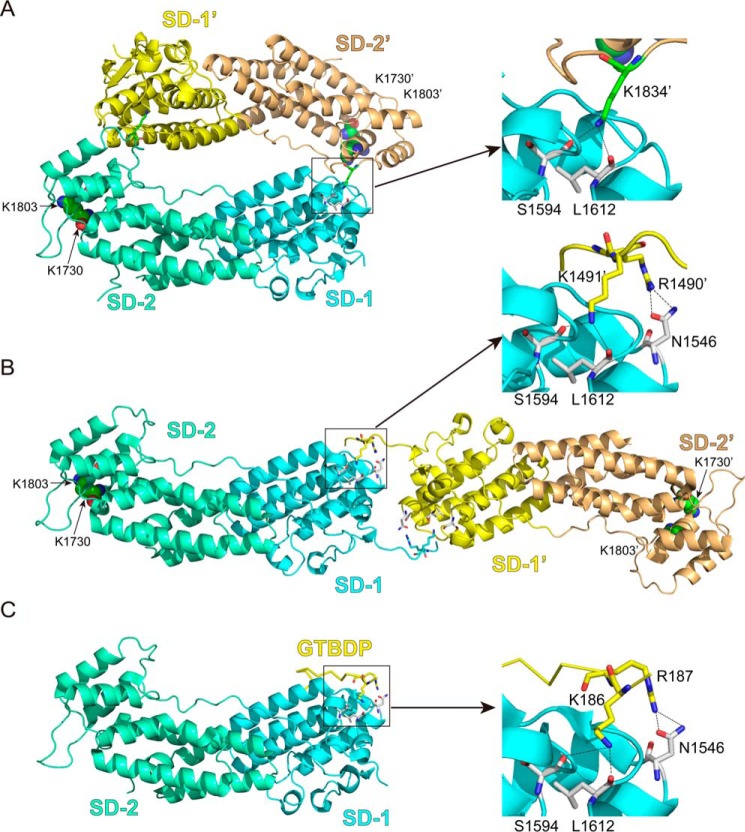
FIGURE 1.
The interactions between the GTD dimer and between Myo5a-GTD and Mlph-GTBDP. A, cartoon representation of the Myo5a-GTD structure (Protein Data Bank code 3WB8) showing a head to tail dimer. There are four putative dimers in the crystal structure of mouse Myo5a-GTD, and only one dimer (chains a and c) is shown here. B, cartoon representation of Myo5b-GTD structure (Protein Data Bank code 4J5M) showing a head to head dimer. C, cartoon representation of the Myo5a-GTD·Mlph-GTBDP complex structure (Protein Data Bank code 4LX2). SD-1 and SD-2 indicate subdomains 1 and 2 of the GTD, respectively. Sticks show the residues at the GTD-GTD interface and the interface between Myo5a-GTD and Mlph-GTBDP. Spheres show the two conserved basic residues Lys1730 and Lys1803, which are essential for inhibiting motor function (7). In the head to tail model of the GTD dimer, the distances between the two Lys1730 and between the two Lys1803 are 79 and 66 Å, respectively. In the head to head model of the GTD dimer, the distances between the two Lys1730 and between the two Lys1803 are 153 and 142 Å, respectively. For clarity, all residue numbers refer to the melanocyte isoform of Myo5a (see “Experimental Procedures” for details).

